
利用K均值聚类精确检测图像中的颜色区域

我在基于颜色的图像分割中使用了K-均值聚类。我有一个2D图像,它有3种颜色,黑色,白色,和绿色。这是图像,
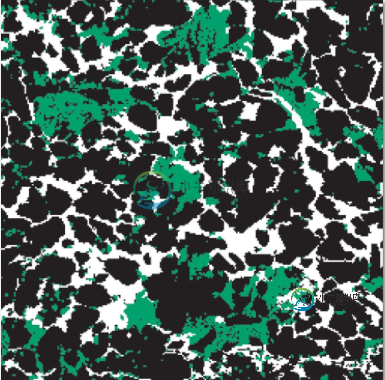
我想让K-means产生3个簇,一个代表绿色区域,第二个代表白色区域,最后一个代表黑色区域。
这是我使用的代码,
%Clustering color regions in an image.
%Step 1: read the image using imread, and show it using imshow.
img = (imread('img.jpg'));
figure, imshow(img), title('X axis rock cut'); %figure is for creating a figure window.
text(size(img,2),size(img,1)+15,...
'Unconventional shale x axis cut', ...
'FontSize',7,'HorizontalAlignment','right');
%Step 2: Convert Image from RGB Color Space to L*a*b* Color Space
conversionform = makecform('srgb2lab'); %the form of the conversion is defined as from rgb to l a b
lab_img = applycform(img,conversionform); %converting the rgb image to l a b image using the conversion form defined above.
%Step 3: Classify the Colors in 'a*b*' Space Using K-Means Clustering
ab = double(lab_img(:,:,2:3));
nrows = size(ab,1);
ncols = size(ab,2);
ab = reshape(ab,nrows*ncols,2);
nColors = 3;
% repeat the clustering 3 times to avoid local minima
[cluster_idx, cluster_center] = kmeans(ab,nColors,'distance','sqEuclidean', ...
'Replicates',3);
%Step 4: Label Every Pixel in the Image Using the Results from KMEANS
%For every object in your input, kmeans returns an index corresponding to a cluster. The cluster_center output from kmeans will be used later in the example. Label every pixel in the image with its cluster_index.
pixel_labels = reshape(cluster_idx,nrows,ncols);
figure, imshow(pixel_labels,[]), title('image labeled by cluster index');
segmented_images = cell(1,3);
rgb_label = repmat(pixel_labels,[1 1 3]);
for k = 1:nColors
color = img;
color(rgb_label ~= k) = 0;
segmented_images{k} = color;
end
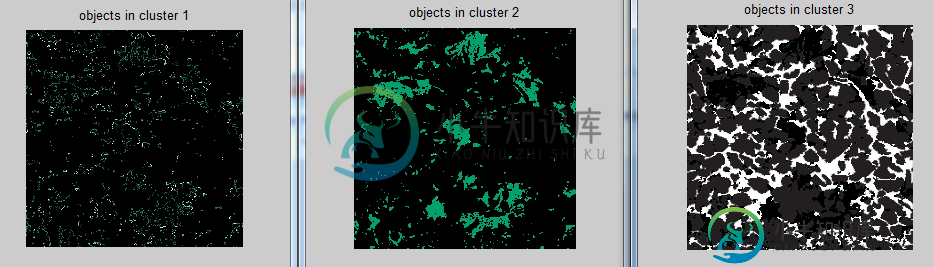
figure, imshow(segmented_images{1}), title('objects in cluster 1');
figure, imshow(segmented_images{2}), title('objects in cluster 2');
figure, imshow(segmented_images{3}), title('objects in cluster 3');
但我没有按要求得到结果。我得到一个带有绿色区域的簇,一个带有绿色区域边界的簇,还有一个带有灰色、黑色和白色的簇。下面是产生的集群。
这样做的目的是,在得到正确的聚类结果后,我想利用连通分量的概念来统计每个区域的像素数。
所以,我的目的是知道每个颜色区域有多少像素。我尝试了另一种更简单的方法,通过得到2D图像的矩阵,并尝试计算出每种颜色的像素数。然而,我在矩阵中发现了3种以上的RGB颜色,可能是因为相同颜色的像素有一个稍微不同的颜色级别。所以我才去做图像分割。
谁能告诉我如何修复上面的代码,以便得到所需的结果吗?
我也会很感激,如果你给我的提示,如何这样做更容易的方式,如果有的话。
im= imread ('img.jpg');

[a b c] = size (im);
%disp ([a b]);
yellow=0;
blue=0;
white=0;
red=0;


for i=1:a
    for j=1:b
        x= impixel(im, i, j)/255 ;
        color= rgb2name (x);
        if (~isempty (strfind (color, 'yellow')))
            yellow= yellow+1;
        elseif (~isempty (strfind(color, 'red')))
            red= red+1;
        elseif (~isempty (strfind (color, 'blue')))
            blue= blue+1;
        elseif (~isempty (strfind (color, 'white')))
           white= white+1;
        else
            %disp ('warning'); break;
        end
        disp (color);
        disp (i);
    end
end
disp (yellow)
disp (red)
disp (blue)
disp (white)
谢谢你。
共有1个答案

这是我计算每个区域像素数量的方法。鉴于(如评论中所讨论的):
- 颜色的值(RGB)和数目(K)是预先已知的
- 压缩伪影和抗锯齿生成额外的颜色,这些颜色必须被认为是K种已知颜色中最近邻的颜色。
既然你先验地知道颜色,你就不需要K-均值了。它实际上可能导致坏的结果,就像你的问题。@CrowdedComputeeer的方法解决了这方面的问题。
img =  (imread('path_to_image'));

colors = [  0 0 0;    % black
            0 1 0;    % green
            1 1 1];   % white


% % You can change the colors
% colors = [  0 0 1;    % red
%             1 1 0;    % yellow
%             1 0 0;    % blue
%             1 1 1];   % white


% Find nearest neighbour color
list = double(reshape(img, [], 3)) / 255;
[~, IDX] = pdist2(colors, list, 'euclidean', 'Smallest', 1);
% IDX contains the indices to the nearest element


N = zeros(size(colors, 1), 1);
for i = 1 : size(colors, 1)
    % Count the number of pixels for each color
    N(i) = sum( IDX == i );
end

% This will display the number of pixels for each color
disp(N);


% Eventually build the masks
indices = reshape(IDX, [size(img,1), size(img,2)]);

figure();
szc = size(colors,1);
for i = 1 : szc
    subplot(1,szc,i);
    imagesc(indices == i);
end
97554     % black
16894     % green
31852     % white
得到的掩码:
-
$k$均值聚类算法(k-means clustering algorithm) 在聚类的问题中,我们得到了一组训练样本集 ${x^{(1)},...,x^{(m)}}$,然后想要把这些样本划分成若干个相关的“类群(clusters)”。其中的 $x^{(i)}\in R^n$,而并未给出分类标签 $y^{(i)}$ 。所以这就是一个无监督学习的问题了。 $K$ 均值聚类算法如下所示: 随机初始化(
-
目标 在本章中,我们将了解K-Means聚类的概念,其工作原理等。 理论 我们将用一个常用的例子来处理这个问题。 T-shirt尺寸问题 考虑一家公司,该公司将向市场发布新型号的T恤。显然,他们将不得不制造不同尺寸的模型,以满足各种规模的人们的需求。因此,该公司会记录人们的身高和体重数据,并将其绘制到图形上,如下所示: 公司无法制作所有尺寸的T恤。取而代之的是,他们将人划分为小,中和大,并仅制造这
-
聚类 聚类,简单来说,就是将一个庞杂数据集中具有相似特征的数据自动归类到一起,称为一个簇,簇内的对象越相似,聚类的效果越好。它是一种无监督的学习(Unsupervised Learning)方法,不需要预先标注好的训练集。聚类与分类最大的区别就是分类的目标事先已知,例如猫狗识别,你在分类之前已经预先知道要将它分为猫、狗两个种类;而在你聚类之前,你对你的目标是未知的,同样以动物为例,对于一个动物集来
-
该向量包含X、Y坐标,即成对的双打。我想为每个用户ID标识坐标集群,所以我在RDD上进行映射,并尝试为每个组运行k-means: 但是当我运行这个时,我从一行中得到了一个NPE: 问题是,我必须将coords转换为RDD来进行K-Means操作。
-
我有一个标题和两个坐标x和y的数据集。我只是好奇bufferedReader在Java中是如何工作的,下面的代码是我从Google获得的,用于在字符串变量中分别获得头和数据。 在使用R进行统计时,我们需要纠正一个行代码,其中我们提到Header=True,它自动从第2行开始读取。 谢谢--
-
问题内容: 我希望能够拍摄图像并找出平均颜色是多少。意思是如果图像是半黑半白,我会在两者之间得到一些…灰色阴影。它可能是最常见的单色或中间值。任何平均值都可以。 我该如何在android中做到这一点。 问题答案: