
Prefuse示例图部分在J面板之外

我想使用Prefuse来可视化图表。我按照他们的教程并尝试了他们的示例应用程序。它的源代码可以在这里找到
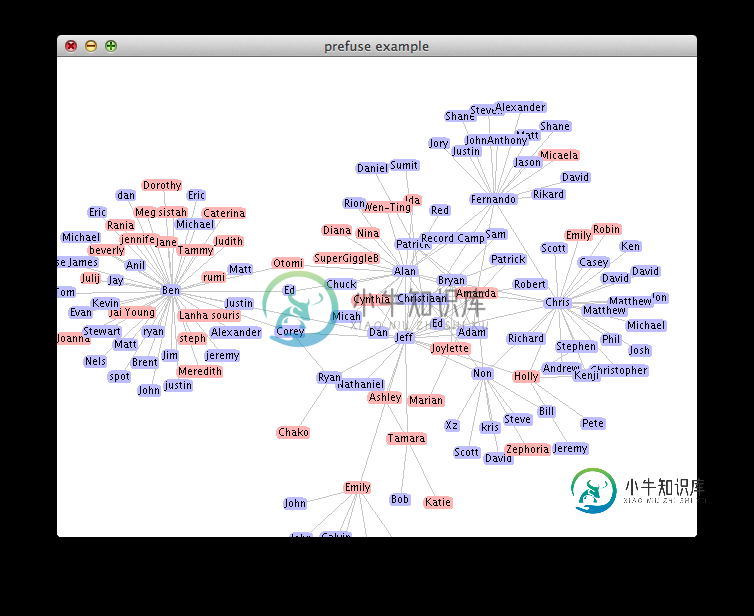
然而,即使我只是简单地复制完整的代码,生成的图形看起来也不像教程中显示的那样。它只是半可见的,卡在JGroup的左上角。它的某些部分丢失了,因为它们必须显示在面板之外。我尝试了自己的一些图表,但我一直遇到同样的现象。
我认为这不是预期的行为,但我不知道在哪里寻找问题。我不知道这是Swing(x)还是prefuse或者...?
更新:这是修改后的代码。我没有从示例中改变太多,只是添加了垃圾神建议的内容。
package visualise;
import javax.swing.JFrame;
import javax.swing.SwingUtilities;
import prefuse.Constants;
import prefuse.Display;
import prefuse.Visualization;
import prefuse.action.ActionList;
import prefuse.action.RepaintAction;
import prefuse.action.assignment.ColorAction;
import prefuse.action.assignment.DataColorAction;
import prefuse.action.layout.graph.ForceDirectedLayout;
import prefuse.activity.Activity;
import prefuse.controls.DragControl;
import prefuse.controls.PanControl;
import prefuse.controls.ZoomControl;
import prefuse.data.Graph;
import prefuse.data.io.DataIOException;
import prefuse.data.io.GraphMLReader;
import prefuse.render.DefaultRendererFactory;
import prefuse.render.LabelRenderer;
import prefuse.util.ColorLib;
import prefuse.visual.VisualItem;

public class PrefuseExample {

public static void main(String[] argv) {
    SwingUtilities.invokeLater(new Runnable() {
        public void run() {
             // -- 1. load the data ------------------------------------------------

            // load the socialnet.xml file. it is assumed that the file can be
            // found at the root of the java classpath
            Graph graph = null;
            try {
                graph = new GraphMLReader().readGraph("../../resources/visualisation/prefuse/Prefuse-master/data/socialnet.xml");
            } catch ( DataIOException e ) {
                e.printStackTrace();
                System.err.println("Error loading graph. Exiting...");
                System.exit(1);
            }


            // -- 2. the visualization --------------------------------------------

            // add the graph to the visualization as the data group "graph"
            // nodes and edges are accessible as "graph.nodes" and "graph.edges"
            Visualization vis = new Visualization();
            vis.add("graph", graph);
            vis.setInteractive("graph.edges", null, false);

            // -- 3. the renderers and renderer factory ---------------------------

            // draw the "name" label for NodeItems
            LabelRenderer r = new LabelRenderer("name");
            r.setRoundedCorner(8, 8); // round the corners

            // create a new default renderer factory
            // return our name label renderer as the default for all non-EdgeItems
            // includes straight line edges for EdgeItems by default
            vis.setRendererFactory(new DefaultRendererFactory(r));


            // -- 4. the processing actions ---------------------------------------

            // create our nominal color palette
            // pink for females, baby blue for males
            int[] palette = new int[] {
                ColorLib.rgb(255,180,180), ColorLib.rgb(190,190,255)
            };
            // map nominal data values to colors using our provided palette
            DataColorAction fill = new DataColorAction("graph.nodes", "gender",
                    Constants.NOMINAL, VisualItem.FILLCOLOR, palette);
            // use black for node text
            ColorAction text = new ColorAction("graph.nodes",
                    VisualItem.TEXTCOLOR, ColorLib.gray(0));
            // use light grey for edges
            ColorAction edges = new ColorAction("graph.edges",
                    VisualItem.STROKECOLOR, ColorLib.gray(200));

            // create an action list containing all color assignments
            ActionList color = new ActionList();
            color.add(fill);
            color.add(text);
            color.add(edges);

            // create an action list with an animated layout
            ActionList layout = new ActionList(Activity.INFINITY);
            layout.add(new ForceDirectedLayout("graph"));
            layout.add(new RepaintAction());

            // add the actions to the visualization
            vis.putAction("color", color);
            vis.putAction("layout", layout);


            // -- 5. the display and interactive controls -------------------------

            Display d = new Display(vis);
            d.setSize(720, 500); // set display size
            // drag individual items around
            d.addControlListener(new DragControl());
            // pan with left-click drag on background
            d.addControlListener(new PanControl());
            // zoom with right-click drag
            d.addControlListener(new ZoomControl());

            // -- 6. launch the visualization -------------------------------------

            // create a new window to hold the visualization
            JFrame frame = new JFrame("prefuse example");
            // ensure application exits when window is closed
            frame.setDefaultCloseOperation(JFrame.EXIT_ON_CLOSE);
            frame.add(d);
            frame.pack();           // layout components in window
            frame.setVisible(true); // show the window

            // assign the colors
            vis.run("color");
            // start up the animated layout
            vis.run("layout");
        }
    });
}
}
共有1个答案

我不熟悉预使用,但许多常见错误可能会导致观察到的问题。看看这个例子,
>
正如这里所讨论的,当您真正想要覆盖getPreferredSize()时,请不要在显示器上使用setSize()。
Swing GUI 对象应仅在事件调度线程 上构造和操作。
初始聚类是图原点的工件,位于(0,0)点的Display组件的左上角。选择了首选大小后,可以pan()到中心。
private static final int W = 640;
private static final int H = 480;
…
Display d = new Display(vis) {

    @Override
    public Dimension getPreferredSize() {
        return new Dimension(W, H);
    }
};
d.pan(W / 2, H / 2);
-
我试图在JPanel上画一些简单的形状,但是有一些困难。如果这个问题似乎以前已经回答过,但其他答案似乎没有帮助,请原谅。 我遵循了一个简单的教程,并成功地在JFrame上绘制了一些基本形状,但是当我将代码如何移动到一个扩展JPel的新类中时,屏幕上什么也没有出现。 我尝试过设置首选大小,重新验证和重新绘画。我添加了对super.paint组件的调用,尽管当我直接绘制到JFrame时,这两个调用都不
-
我正在尝试构建一个基于按钮的动态应用程序,这些按钮从创建的面板内部切换JFrame的主面板(这是我的应用程序的顶部内容)。 这个问题更多的是设计问题,而不是开发问题。我不确定我的设计,但我会试着解释一下。 我有一个JFrame代表我的应用程序,其中包含一个JTabbedPane(和多个Tabs)。每个选项卡都包含一个默认的JPanel,在那个JPanel中,我调用一个正在呈现我的视图的控制器(我正
-
我现在正在做一个项目,但我找不到解决问题的方法。 这就是我的问题:我有一个JFrame,然后我添加了一个容器JPanel,并向这个容器面板添加了另外两个JPanel,第一个面板(InputPanel)用于用户输入,第二个面板(Board)用于根据用户输入显示指定的算法。 请注意,在我的Board类中,我重写了paintComponent(图形g)来绘制算法。 主框架中的我的代码: 我最初的计划是在
-
我目前正在为学校开发一款Java的2D游戏。我们必须使用抽象工厂设计模式。对于2D实现,我使用如下工厂: 在我的显示类中,我创建了一个 JFrame 和 Jpanel 现在,从我的主gameloop中,我调用Java2DPLay的类中的可视化方法来可视化我的游戏体验 我的目标是将JPanel传递给每个实体,并让它在显示之前将其内容绘制到面板上。然而,我似乎不知道该怎么做。当通过改变面板的图形来使用
-
prefuse是一个用户界面包用来把有结构与无结构数据以具有交互性的可视化图形展示出来.这包括的数据有任何可以被描述成一组实体(或节点)或者可以被连接在一起的一些关系(或边缘).prefuse支持的数据包括具有层次性(如:文件系统,组织图),网络(网络拓扑,网站链接),和甚至是没有连接的数据集(如:时间线).以下是一个DEMO.
-
我有一个深灰色的,上面有一个。我将新颜色(0、0、0、5f)设置为标签的背景,并使用按钮多次更改文本。问题是,每次文本更改时,前一个文本仍保留在新文本后面。我将文本从“123456789”改为“1234567”、“12345”和“123”。以下是截图: 我该如何摆脱这个“阴影”?