
dplyr根据是否在组中进行总结

我正在寻找一种方法来制作一个汇总表,将R中某个因子的每个级别的值与该因子的所有其他级别的值进行比较。虹膜数据集的一个例子是,我想将setosa与所有其他人(即,versicolor和virginica)进行比较,然后将versicolor与其他人(setosa和virginica)进行比较,最后将virignica与其他人(versicolor和setosa)进行比较。在我的实际数据集中,我有许多组,所以我不想硬编码每个级别。如果可能的话,我正在寻找一个简单的解决方案。我想要的结果是一个如下所示的汇总表:
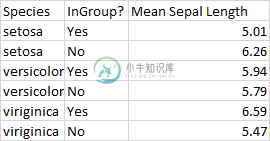
这里-组中的“是”是属于该组的物种(因此对于Setosa,它将仅是setosa),而“否”是不属于该组的物种(因此对于Setosa-不,它将是versicolor和virgnicia的组合)。
共有2个答案

1)我们可以在< code>dplyr本身中完成这项工作。通过使用< code>cur_group_id()(不使用除< code>dplyr之外的任何其他包)将列的< code >平均值和完整数据列的子集连接起来,按“物种”分组,< code >总结我们需要的列,即“Sepal.length”
library(dplyr)
iris %>%
    group_by(Species) %>%
    summarise(InGroup = c('Yes', 'No'), MeanSepalLength = c(mean(Sepal.Length),
       mean(.$Sepal.Length[as.numeric(.$Species) != cur_group_id()])),
          .groups = 'drop')
# A tibble: 6 x 3
#  Species    InGroup MeanSepalLength
#  <fct>      <chr>             <dbl>
#1 setosa     Yes                5.01
#2 setosa     No                 6.26
#3 versicolor Yes                5.94
#4 versicolor No                 5.80
#5 virginica  Yes                6.59
#6 virginica  No                 5.47
2)如果我们想在多列中这样做,请使用< code > cross
iris %>%
    group_by(Species) %>%
    summarise(InGroup = c('Yes', 'No'),
       across(where(is.numeric),  ~ c(mean(.),
       mean(iris[[cur_column()]][
         as.numeric(iris$Species) != cur_group_id()])), .names = 'Mean{.col}'),
          .groups = 'drop')
-输出
# A tibble: 6 x 6
#  Species    InGroup MeanSepal.Length MeanSepal.Width MeanPetal.Length MeanPetal.Width
#  <fct>      <chr>              <dbl>           <dbl>            <dbl>           <dbl>
#1 setosa     Yes                 5.01            3.43             1.46           0.246
#2 setosa     No                  6.26            2.87             4.91           1.68
#3 versicolor Yes                 5.94            2.77             4.26           1.33
#4 versicolor No                  5.80            3.20             3.51           1.14
#5 virginica  Yes                 6.59            2.97             5.55           2.03
#6 virginica  No                  5.47            3.10             2.86           0.786
3)如果我们需要一个函数,也可以创建
f1 <- function(dat, grp) {
    grp_str <- rlang::as_string(rlang::ensym(grp))
    dat %>%
       group_by({{grp}}) %>%
       summarise(InGroup = c('Yes', 'No'),
            across(where(is.numeric), ~ c(mean(.),
                 mean(dat[[cur_column()]][
                      as.numeric(dat[[grp_str]]) != cur_group_id()])),
                   .names = 'Mean{.col}'), .groups = 'drop')
    }
-测试
f1(iris, Species)
# A tibble: 6 x 6
#  Species    InGroup MeanSepal.Length MeanSepal.Width MeanPetal.Length MeanPetal.Width
#  <fct>      <chr>              <dbl>           <dbl>            <dbl>           <dbl>
#1 setosa     Yes                 5.01            3.43             1.46           0.246
#2 setosa     No                  6.26            2.87             4.91           1.68
#3 versicolor Yes                 5.94            2.77             4.26           1.33
#4 versicolor No                  5.80            3.20             3.51           1.14
#5 virginica  Yes                 6.59            2.97             5.55           2.03
#6 virginica  No                  5.47            3.10             2.86           0.786
或使用菱形
f1(diamonds, cut)
# A tibble: 10 x 9
#   cut       InGroup Meancarat Meandepth Meantable Meanprice Meanx Meany Meanz
#   <ord>     <chr>       <dbl>     <dbl>     <dbl>     <dbl> <dbl> <dbl> <dbl>
# 1 Fair      Yes         1.05       64.0      59.1     4359.  6.25  6.18  3.98
# 2 Fair      No          0.790      61.7      57.4     3920.  5.72  5.72  3.53
# 3 Good      Yes         0.849      62.4      58.7     3929.  5.84  5.85  3.64
# 4 Good      No          0.793      61.7      57.3     3933.  5.72  5.72  3.53
# 5 Very Good Yes         0.806      61.8      58.0     3982.  5.74  5.77  3.56
# 6 Very Good No          0.796      61.7      57.3     3919.  5.73  5.72  3.53
# 7 Premium   Yes         0.892      61.3      58.7     4584.  5.97  5.94  3.65
# 8 Premium   No          0.766      61.9      57.0     3709.  5.65  5.66  3.50
# 9 Ideal     Yes         0.703      61.7      56.0     3458.  5.51  5.52  3.40
#10 Ideal     No          0.861      61.8      58.5     4249.  5.88  5.88  3.63
4)或者另一种选择是取sum中的差异并除以行数的差异
iris %>%
    group_by(Species) %>%
    summarise(InGroup = c('Yes', 'No'), across(where(is.numeric),
       ~  c(mean(.), (sum(iris[[cur_column()]]) -
           sum(.))/(nrow(iris) - n())), .names = 'Mean{.col}'), .groups = 'drop')

在下面的代码中,我们使用< code>map分别对每个级别的< code>Species进行操作。对于每次迭代,我们创建一个分组列< code>in.group,标记一行是否是给定种类的成员。然后,我们按组返回所有数字列的平均值:
library(tidyverse)

unique(as.character(iris$Species)) %>%
  set_names() %>%
  map_df(
    ~iris %>%
      group_by(in.group = Species==.x) %>%
      summarise(across(where(is.numeric), mean, .names="mean_{col}")),
    .id="Species"
  )
#> # A tibble: 6 x 6
#>   Species    in.group mean_Sepal.Length mean_Sepal.Width mean_Petal.Length
#>   <chr>      <lgl>                <dbl>            <dbl>             <dbl>
#> 1 setosa     FALSE                 6.26             2.87              4.91
#> 2 setosa     TRUE                  5.01             3.43              1.46
#> 3 versicolor FALSE                 5.80             3.20              3.51
#> 4 versicolor TRUE                  5.94             2.77              4.26
#> 5 virginica  FALSE                 5.47             3.10              2.86
#> 6 virginica  TRUE                  6.59             2.97              5.55
#> # … with 1 more variable: mean_Petal.Width <dbl>
您还可以将以下内容添加到链中,以使输出更加经济:
  mutate(Species = case_when(in.group ~ Species,
                             !in.group ~ paste("not", Species))) %>%
  select(-in.group)
这给出了:
  Species        mean_Sepal.Length mean_Sepal.Width mean_Petal.Length mean_Petal.Width
1 not setosa                  6.26             2.87              4.91            1.68
2 setosa                      5.01             3.43              1.46            0.246
3 not versicolor              5.80             3.20              3.51            1.14
4 versicolor                  5.94             2.77              4.26            1.33
5 not virginica               5.47             3.10              2.86            0.786
6 virginica                   6.59             2.97              5.55            2.03
您可以将它打包成一个函数:
compare.groups = function(data, group) {

  group = ensym(group)

  # Get levels of group
  x = data %>%
    distinct(!!group) %>%
    pull(!!group) %>%
    as.character %>%
    set_names()

  # Map over each level
  x %>%
    map_df(
      ~ data %>%
          group_by(in.group = !!group == .x) %>%
          summarise(across(where(is.numeric), mean, .names="mean_{col}")),
      .id=as_label(enquo(group))
    ) %>%
    mutate(!!group := case_when(in.group ~ !!group,
                                !in.group ~ paste("not", !!group))) %>%
    select(-in.group)
}

# Run the function on a couple of data frames
compare.groups(iris, Species)
compare.groups(diamonds, cut)
您还可以使用该函数获取数据框中所有分类列的结果:
diamonds %>%
  select(where(~!is.numeric(.))) %>%
  names() %>%
  set_names() %>%
  map_df(
    ~compare.groups(diamonds, !!.x) %>%
      rename(category = .x),
    .id="variable"
  )
   variable category      mean_carat mean_depth mean_table mean_price mean_x mean_y mean_z
 1 cut      not Ideal          0.861       61.8       58.5      4249.   5.88   5.88   3.63
 2 cut      Ideal              0.703       61.7       56.0      3458.   5.51   5.52   3.40
 3 cut      not Premium        0.766       61.9       57.0      3709.   5.65   5.66   3.50
 4 cut      Premium            0.892       61.3       58.7      4584.   5.97   5.94   3.65
 5 cut      not Good           0.793       61.7       57.3      3933.   5.72   5.72   3.53
 6 cut      Good               0.849       62.4       58.7      3929.   5.84   5.85   3.64
 7 cut      not Very Good      0.796       61.7       57.3      3919.   5.73   5.72   3.53
 8 cut      Very Good          0.806       61.8       58.0      3982.   5.74   5.77   3.56
 9 cut      not Fair           0.790       61.7       57.4      3920.   5.72   5.72   3.53
10 cut      Fair               1.05        64.0       59.1      4359.   6.25   6.18   3.98
11 color    not E              0.829       61.8       57.4      4123.   5.80   5.80   3.58
12 color    E                  0.658       61.7       57.5      3077.   5.41   5.42   3.34
13 color    not I              0.772       61.7       57.4      3803.   5.68   5.68   3.50
14 color    I                  1.03        61.8       57.6      5092.   6.22   6.22   3.85
15 color    not J              0.778       61.7       57.4      3856.   5.69   5.69   3.51
16 color    J                  1.16        61.9       57.8      5324.   6.52   6.52   4.03
17 color    not H              0.777       61.7       57.4      3832.   5.69   5.69   3.51
18 color    H                  0.912       61.8       57.5      4487.   5.98   5.98   3.70
19 color    not F              0.811       61.8       57.5      3977.   5.76   5.76   3.55
20 color    F                  0.737       61.7       57.4      3725.   5.61   5.62   3.46
# … with 20 more rows
-
问题内容: 我正在使用Oracle SQL,并且想对一些“喜欢”函数结果的不同行进行分组。举例说明: 假设我有一个表MESA,其中的一列是一个巨大的字符串。 我正在计算与特定模式匹配的行数: 因此,假设此查询的结果为: 水果..afsafafasfa … RED_APPLE 20 水果..afsafafasfa … YELLOW_APPLE 12 水果..afsafafasfa … GREEN_A
-
问题内容: 在MySQL中,我试图找到一种有效的方法来执行更新(如果表中已经存在一行),或者执行INSERT(如果该行不存在)。 到目前为止,我发现了两种可能的方法: 一个明显的例子:打开一个事务,选择以查找该行是否存在,如果不存在则进行INSERT,如果存在则进行UPDATE,提交事务 首先将IGNORE插入表中(如果该行已存在,则不会引发错误),然后进行更新 第二种方法避免了交易。 您认为哪一
-
我有两个整数数组,我试图根据另一个数组对第一个数组进行排序。 例如。和 b = {1,2,2,0,0, 在 B 中排序的值是 A 中每个整数的实值 排序后我期望的预期结果是: 这是我用的代码 它给出了我的输出:<code>a={2,3,1,0,0,6}和
-
我的数据框就像这个 由reprex包(v2.0.1)于2022-02-17创建 我想在grouping_bycol1之后根据count_col1和count_col2选择具有最大值的行。 我希望我的数据看起来像这样 你可以写一篇专栏文章 但不是两个人
-
假设我有以下Bus对象数组: 在总线数组填满之后,我想按总线号对总线数组进行排序(这是一个字符串,例如“501”)。每个总线对象都有一个总线号(总线[index].number)。没有重复的公共汽车号码。我怎样才能做到这一点?我看到了过滤器,但我不确定如何应用它。
-
问题内容: 我正在尝试优化使用MySQL 5.1中的视图的查询。似乎即使我从视图中选择1列,它始终会进行全表扫描。那是预期的行为吗? 该视图只是我在下面的第一个查询中指定的表的SELECT“这些表中的所有列-NOT *”。 这是当我从组成视图的查询中选择索引列PromotionID时的解释输出。如您所见,它与视图上的输出有很大的不同。 当我从视图中选择相同的东西时的输出 问题答案: MySQL中的