
如何在Chart.js中放置静态点并绘制垂直线

js社区,
我想用Chart.js做一些定制,但我遇到了一些基本问题...
我所达到的,你可以在这张照片中看到
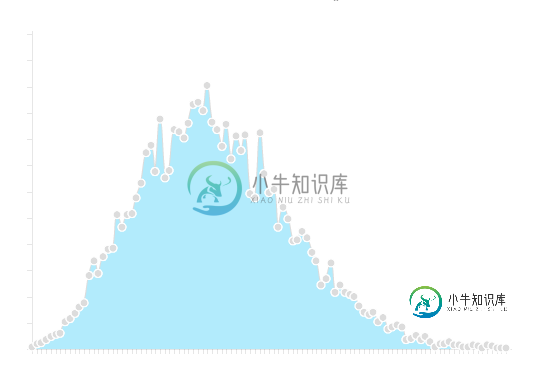
我的问题是我如何在图表中有固定点?有什么方法可以做到这一点吗?我尝试的是{showXLabels: 10}在chartj折线图上建议的极限标签数
到目前为止,我找不到任何逻辑解决方案来做这件事,我也尝试直接修改库,但到目前为止没有运气。
我的目标是实现这个
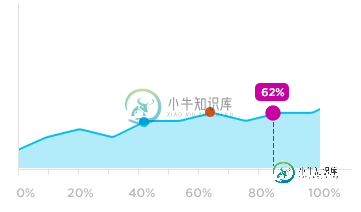
我想知道是否有人能给我一些聪明的建议?
或者我可以使用的其他库,以使第二个图形工作
共有1个答案

只需扩展图表(实际上,如果您不需要工具提示,则可以在 onAnimation Completelete 回调中执行相同的操作)
var data = {
    labels: ['0%', '10%', '20%', '30%', '40%', '50%', '60%', '70%', '80%', '90%', '100%'],
    datasets: [{
        strokeColor: 'rgba(0, 190, 242, 1)',
        fillColor: 'rgba(177, 235, 250, 1)',
        data: [12, 30, 20, 10, 30, 50, 70, 76, 80, 90, 95]
    }]
};


var ctx = document.getElementById("LineExt").getContext("2d");
Chart.types.Line.extend({
    name: "LineExt",
    initialize: function () {
        Chart.types.Line.prototype.initialize.apply(this, arguments);

        // hide alternate x labels on the scale
        var xLabels = this.scale.xLabels;
        xLabels.forEach(function (xLabel, i) {
            if (i % 2)
                xLabels[i] = '';
        })
    },
    draw: function () {
        Chart.types.Line.prototype.draw.apply(this, arguments);

        var scale = this.scale;
        var points = this.datasets[0].points;
        var ctx = this.chart.ctx;
        var options = this.options;

        ctx.save();
        var y0 = scale.calculateY(0);
        this.options.points.forEach(function (point) {
            // linearly extrapolate y value from nearby points
            point.y = (points[Math.floor(point.xIndex)].value + points[Math.ceil(point.xIndex)].value) / 2;

            var x = scale.calculateX(point.xIndex);
            var y = scale.calculateY(point.y);

            // draw the circle
            ctx.beginPath();
            ctx.arc(x, y, 5, 0, 2 * Math.PI);
            ctx.fillStyle = point.color;
            ctx.fill();

            if (point.dropLine) {
                ctx.beginPath();
                ctx.moveTo(x, y);
                ctx.lineTo(x, y0);
                ctx.setLineDash([5, 5]);
                ctx.lineWidth = 2;
                ctx.strokeStyle = point.color;
                ctx.stroke();

                // use the same function that chart.js uses to draw the tooltip to draw our label
                var text = Chart.helpers.template(options.boxTemplate, { value: point.y })
                var boxWidth = ctx.measureText(text).width + 2 * options.tooltipXPadding;
                var boxHeight = options.tooltipFontSize + 2 * options.tooltipYPadding;
                Chart.helpers.drawRoundedRectangle(ctx, x - boxWidth / 2, y - boxHeight - options.tooltipCaretSize, boxWidth, boxHeight, options.tooltipCornerRadius);
                ctx.fill();
                ctx.fillStyle = '#fff';
                ctx.textAlign = 'center';
                ctx.textBaseline = 'middle';
                ctx.fillText(text, x, y - boxHeight / 2 - options.tooltipCaretSize);
            }
        })
        ctx.restore();
    }
});

new Chart(ctx).LineExt(data, {
    scaleLabel: "<%=''%>",
    tooltipTemplate: "<%if (label){%><%=label%>: <%}%><%= value %>",
    scaleFontColor: 'rgba(193, 193, 193, 1)',
    pointDot: false,
    bezierCurve: false,
    scaleOverride: true,
    scaleSteps: 10,
    scaleStepWidth: 10,
    scaleStartValue: 0,
    datasetStrokeWidth: 5,
    points: [
        { xIndex: 4.5, color: 'rgba(0, 190, 242, 1)' },
        { xIndex: 6.5, color: 'rgba(208, 84, 25, 1)' },
        { xIndex: 8, color: 'rgba(199, 0, 160, 1)', dropLine: true }
    ],
    boxTemplate: "<%=value%>%"
});
小提琴-http://jsfiddle.net/4jbdy2d7/
-
给定一个信号的时间表示图,如何画出相应的时间指标线? 具体来说,给定一个时间索引范围为0到2.6(s)的信号图,我想画垂直红线,指示列表的相应时间索引,我该怎么做?
-
问题内容: 我有这样的标记: div高于img: 我需要将图像放置在div的中间(在其上下具有相同的空白)。 我试过了,它不起作用: 问题答案: 如果您的图像纯粹是装饰性的,那么将其用作背景图像可能是一种更语义化的解决方案。然后您可以指定背景的位置 如果它不是装饰性的并且构成有价值的信息,则img标签是合理的。在这种情况下,您需要使用以下属性设置包含div的样式:
-
问题内容: 无论div元素有多高,我如何在h1标签内垂直居中放置h1标签?即如果用户更改他的浏览器高度,我希望h1根据新的高度在中心垂直对齐。 谢谢。 问题答案: 我遇到过的最好的解决方案是利用属性并将wrapper元素设置为,以允许对元素的使用居中: HTML CSS 经过测试 Windows XP Professional 2002版Service Pack 3 Internet Explor
-
问题内容: 给定时间表示中的信号图,如何绘制标记相应时间索引的线? 具体来说,给定时间索引范围为0到2.6(s)的信号图,我想绘制垂直红线以指示列表的相应时间索引,我该怎么办? 问题答案: 添加无需覆盖实际高度即可覆盖整个绘图窗口的垂直线的标准方法是 要么 您可以使用许多可用于其他情节命令的关键字(例如,,…)。您可以传递关键字参数,如果愿意,可以传递坐标(例如,将覆盖图的中部)。水平线()和矩形
-
问题内容: 我知道这是一个简单的概念,但是我在字体指标方面苦苦挣扎。水平居中不太困难,但垂直居中似乎有点困难。 我试过以各种组合使用FontMetrics的getAscent,getLeading,getXXXX方法,但是无论我尝试过什么,文本总是偏离几个像素。有没有一种方法可以测量文本的确切高度,以使其准确居中。 问题答案: 注意,您 确实 需要仔细考虑垂直居中的含义。 字体呈现在基线上,沿着文
-
问题内容: 如何使用HTML制作垂直线? 问题答案: 在您希望该行显示在旁边的标记周围放置一个标记,并使用CSS对其进行样式设置: