matplotlib文本注释水平


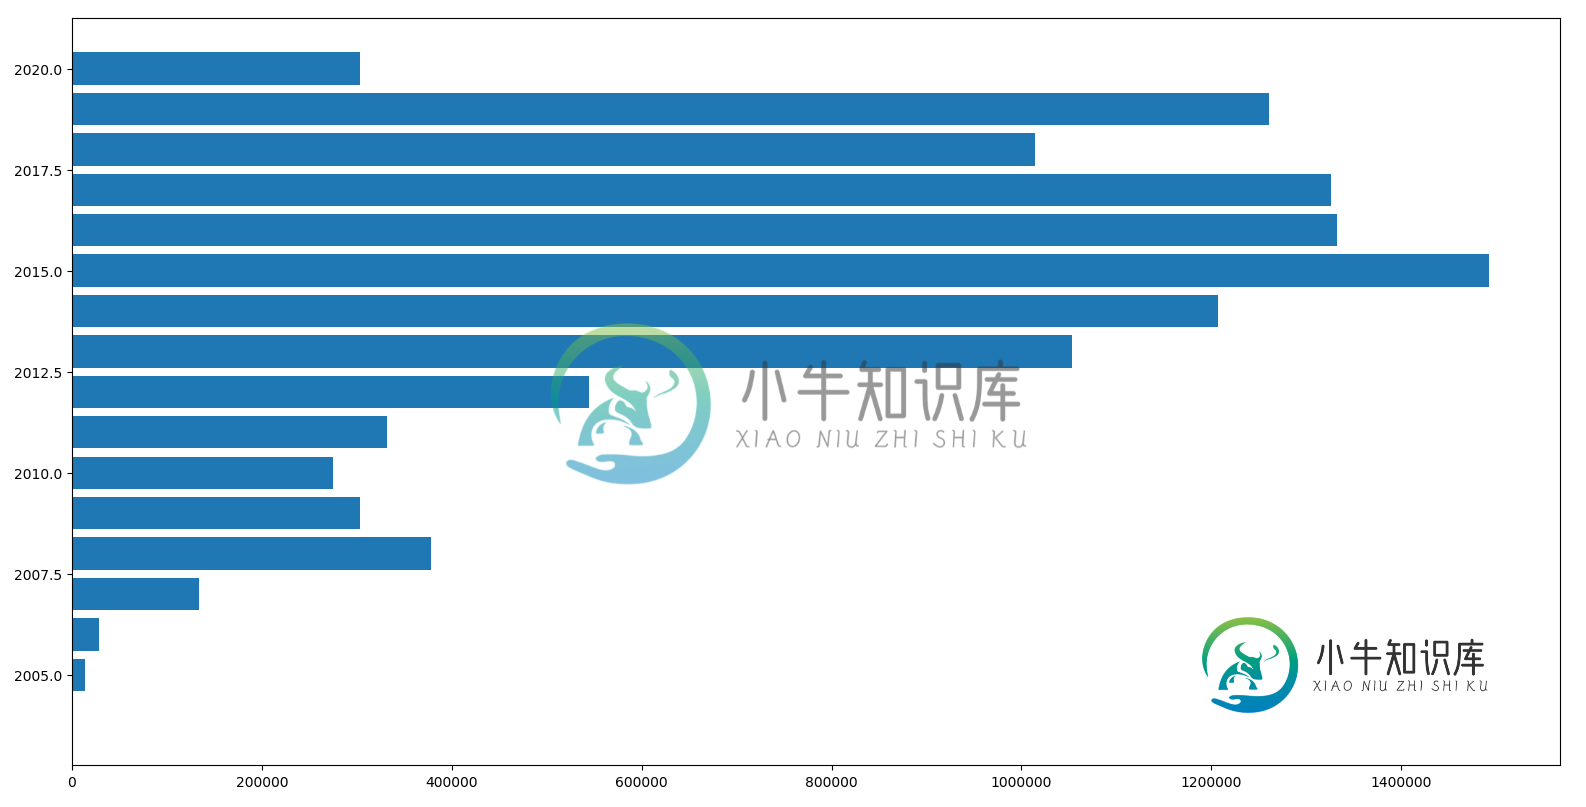
条形图的代码如下:
xs = sumAgent['Year'].values
ys = sumAgent['agentCom'].values
plt.barh(xs,ys)
我有一个字符串列表:lst = ['A ',' B ',' C ',' D ',' E ',' F ',' G ',' H ',' I ',' J']
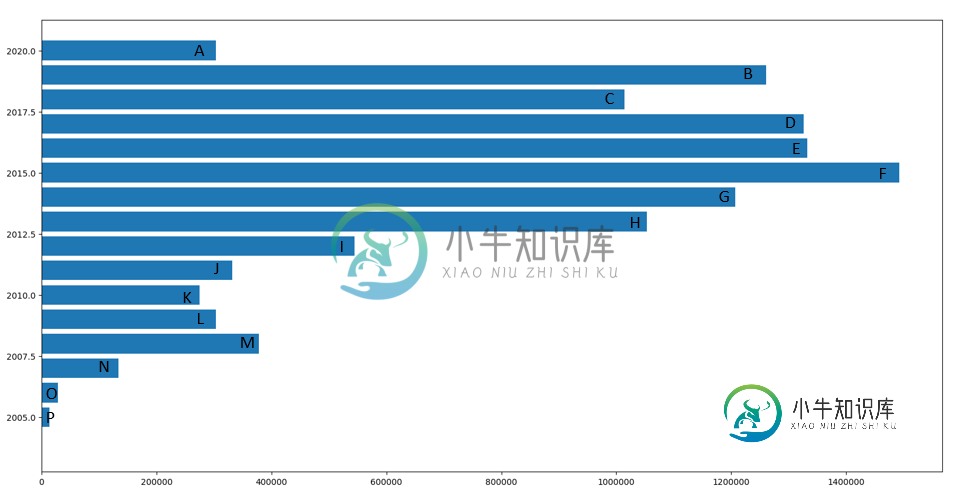
我想用以下字符串注释我的柱线(列表的第一个元素=第一根柱线的注释)。
for x,y in zip(xs,ys):

label = "{:.2f}".format(y)

plt.annotate('A', # this is the text
             (x,y), # this is the point to label
             textcoords="offset points", # how to position the text
             xytext=(0,10), # distance from text to points (x,y)
             ha='center') # horizontal alignment can be left, right or center
当然,它会用值A标注所有的条形,位置不在条形图内。
有什么办法可以解决这个问题吗?
共有1个答案
这里有一个使用修改版答案的例子:https://stackoverflow.com/a/51410758/42346
df = pd.DataFrame({'a':[10,50,100,150,200,300],'b':[5,10,30,50,200,250]})
rects = plt.barh(df['a'].values,df['b'].values,height=13)

for rect in rects:
     x_value = rect.get_width()
     y_value = rect.get_y() + rect.get_height() / 2

     # Number of points between bar and label. Change to your liking.
     space = -1
     ha = 'right'

     # If value of bar is low: Place label right of bar
     if x_value < 20:
         # Invert space to place label to the right
         space *= -1
         ha = 'left'

     # Use X value as label and format number with no decimal places
     label = "{:.0f}".format(x_value)

     # Create annotation
     plt.annotate(
         label,                      # Use `label` as label
         (x_value+space, y_value),         # Place label at end of the bar
         xytext=(space, 0),          # Horizontally shift label by `space`
         textcoords="offset points", # Interpret `xytext` as offset in points
         va='center',                # Vertically center label
         ha=ha)                      # Horizontally align label differently.
-
我需要注释水平条形图。我能够使用matplotlib网站上显示的示例来注释垂直条形图,但是对于 horizonatl 的类似想法似乎不起作用。 以下是垂直方向的小型工作示例: 以下是我想要使用的代码,但不适用于水平图形 感谢任何帮助,提前感谢!
-
我需要提取word文档评论和他们评论的文本。下面是我当前的解决方案,但它无法正常工作 输出为(不正确): 预期产出为: 请帮我一个更好的方法来显示word文档评论和他们评论的文本。如果你需要额外的细节让我知道我会提供所有所需的细节
-
问题内容: 我正在matplotlib中绘制热图,使用: 我如何用绘制的实际数字标注热图?意义在 在绘制的热图的每个单元格中,输入对应于该单元格的值 传递给“pcolor”的5x5矩阵。谢谢。 问题答案: 没有自动的特性来做这样的事情,但是你可以循环通过 每一点并将文本放在适当的位置:
-
Matplotlib 支持广泛的文本格式,比如 TTF 页面语言、Unicode 字符等。这是因为 Matplotlib 内置了 matplotlib.font_manager 字体管理器,它是一个实现了跨平台,并符合 W3C 字体查找算法的字体集合。 TTF(TrueType Font) 是苹果公司和微软公司合作开发的页面描述语言,用来描述字符的轮廓,结合了光栅技术和矢量技术的优点。 用户可以对
-
我正在开发一个应用程序,使用: Java 1.7 我想对一些字符串属性使用PostgreSQL文本数据类型。据我所知,在JPA中,要使用PostgreSQL中的文本,这应该是正确的注释: 当我像这样注释我的实体时,我遇到的错误如下所示:http://www.shredzone.de/cilla/page/299/string-lobs-on-postgresql-with-hibernate-36
-
我可以用以下代码填充文本框注释,但文本不会出现在某些阅读器中,比如Adobe Acrobat,尽管它确实出现在Chrome和其他基于Webkit的浏览器中。我试图填写的PDF文件不使用AcroForms或FDF。我使用的是ApachePDFBox,但我认为PDF库中没有太大差异,即使是跨语言/平台。 我尝试过将我的PDF输出与填充Chrome的文档进行比较,但我看到的唯一区别是默认外观(DA)属性

