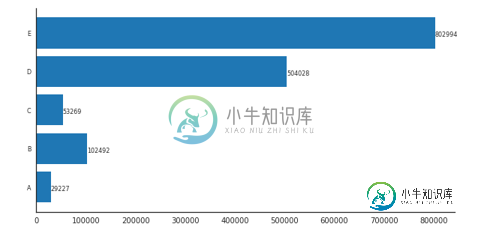
如何向条形图添加多个注释
我想在我的pandas条形图中添加百分比值-以及计数。然而,我不能这样做。我的代码如下所示,到目前为止,我可以得到要显示的计数值。有人能帮我在每个条显示的计数值旁边/下面添加相对%值吗?
import matplotlib
import matplotlib.pyplot as plt
%matplotlib inline
plt.style.use('ggplot')

import seaborn as sns
sns.set_style("white")

fig = plt.figure()
fig.set_figheight(5)
fig.set_figwidth(10)

ax = fig.add_subplot(111)

counts = [29227, 102492,  53269, 504028, 802994]

y_ax = ('A','B','C','D','E')
y_tick = np.arange(len(y_ax))

ax.barh(range(len(counts)), counts, align = "center", color = "tab:blue")
ax.set_yticks(y_tick)
ax.set_yticklabels(y_ax, size = 8)

#annotate bar plot with values
for i in ax.patches:
    ax.text(i.get_width()+.09, i.get_y()+.3, str(round((i.get_width()), 1)), fontsize=8)

sns.despine()
plt.show();
我的代码的输出如下所示。如何在显示的每个计数值旁边添加%值?

共有1个答案
- 用
熊猫v1.2.4测试
import pandas as pd
import matplotlib.pyplot as plt

# create the dataframe from values in the OP
counts = [29227, 102492,  53269, 504028, 802994]
df = pd.DataFrame(data=counts, columns=['counts'], index=['A','B','C','D','E'])

# add a percent column
df['%'] = df.counts.div(df.counts.sum()).mul(100).round(2)

# display(df)
   counts      %
A   29227   1.96
B  102492   6.87
C   53269   3.57
D  504028  33.78
E  802994  53.82
-
< li >使用< code > matplotlib . py plot . bar _ label < li >有关< code >的更多详细信息和示例,请参阅如何在条形图上添加数值标签。条形标签。 < li >使用< code>pandas v1.2.4进行测试,该版本使用< code>matplotlib作为绘图引擎。 < li >有些格式可以用< code>fmt参数完成,但更复杂的格式应该用< code>labels参数完成。
ax = df.plot(kind='barh', y='counts', figsize=(10, 5), legend=False, width=.75,
             title='This is the plot generated by all code examples in this answer')

# customize the label to include the percent
labels = [f' {v.get_width()}\n {df.iloc[i, 1]}%' for i, v in enumerate(ax.containers[0])]

# set the bar label
ax.bar_label(ax.containers[0], labels=labels, label_type='edge', size=13)

ax.spines['right'].set_visible(False)
ax.spines['top'].set_visible(False)
plt.show()
# plot the dataframe
ax = df.plot(kind='barh', y='counts', figsize=(10, 5), legend=False, width=.75)
for i, y in enumerate(ax.patches):

    # get the percent label
    label_per = df.iloc[i, 1]

    # add the value label
    ax.text(y.get_width()+.09, y.get_y()+.3, str(round((y.get_width()), 1)), fontsize=10)

    # add the percent label here
    ax.text(y.get_width()+.09, y.get_y()+.1, str(f'{round((label_per), 2)}%'), fontsize=10)

ax.spines['right'].set_visible(False)
ax.spines['top'].set_visible(False)
plt.show()
-
< li >使用< code > matplotlib v 3 . 3 . 4 进行测试
import matplotlib.pyplot as plt

fig, ax = plt.subplots(figsize=(10, 5))

counts = [29227, 102492,  53269, 504028, 802994]

# calculate percents
percents = [100*x/sum(counts) for x in counts]

y_ax = ('A','B','C','D','E')
y_tick = np.arange(len(y_ax))

ax.barh(range(len(counts)), counts, align = "center", color = "tab:blue")
ax.set_yticks(y_tick)
ax.set_yticklabels(y_ax, size = 8)

#annotate bar plot with values
for i, y in enumerate(ax.patches):
    label_per = percents[i]
    ax.text(y.get_width()+.09, y.get_y()+.3, str(round((y.get_width()), 1)), fontsize=10)
    # add the percent label here
    # ax.text(y.get_width()+.09, y.get_y()+.3, str(round((label_per), 2)), ha='right', va='center', fontsize=10)
    ax.text(y.get_width()+.09, y.get_y()+.1, str(f'{round((label_per), 2)}%'), fontsize=10)

ax.spines['right'].set_visible(False)
ax.spines['top'].set_visible(False)
plt.show()
- 你可以玩定位
- JohanC提到的其他格式选项
- 在一个字符串中打印文本的两部分,中间有一个<code>\n
str(f'{round((y.get_width()),1)}\n{rounds((label_per),2)}%}ax.text(…,va='center')垂直居中,并能够使用稍大的字体- <代码>ax。设置_xlim(0,最大(计数)*1.18)以获得更多的文本空间
- 每一行文本都有一个空格,以获得自然的“水平”填充
str(f'{round((label_per),2)}%),注意{前面的空格
y。get_width().09非常接近y。get_width()当这些值为数万时
-
正在尝试向添加多个图像。我尝试了以下方法(为了简单起见修改了): 我还尝试使用将图像添加到中,并使用该索引使用设置
-
问题内容: 我正在绘制某些类别中各个办公室的交叉表。我想放一张水平堆叠的条形图,在其中标记每个办公室及其值。 这是一些示例代码: 经过研究,我想到了以下代码,可以在“类别”轴上正确排列标签: 但这不包括条的“堆积”。我还尝试遍历plot命令返回的容器(可以让我检索每个矩形的x和y位置),但是随后我失去了与办公室标签的任何连接。 问题答案: 弄清楚了。如果我遍历数据帧每一行的列,则可以建立一个所需标
-
我知道如何在
-
问题内容: 在Bokeh指南中,可以创建各种条形图的示例。http://docs.bokeh.org/en/0.10.0/docs/user_guide/charts.html#id4 此代码将创建一个: 我的问题是是否可以向图表的每个单独的条形添加数据标签?我在网上搜索,但找不到明确的答案。 问题答案: 使用标签集 使用Labelset在每个单独的条形上方创建标签 在我的示例中,我将vbar与绘
-
这是我生成10条不同颜色条的代码。我想分别添加图例,但它只显示黄色图例。我可以更改其颜色,但我想要3个图例。 我认为它只显示一种颜色,因为只有一个系列。是否可以为单个系列添加多个图例? 或者如果我可以将此图像作为图例添加到图表的左中 我需要如何在条形图中显示图像,或者如何为单个系列条形图创建3个不同的标签
-
问题内容: 我创建了一个扩展awt.Polygon类的类。我正在尝试编写一种方法,该方法给出了多边形的PathIterator和一个表示顶点的Point,将点添加到路径中的适当位置。 例如:一个点为(0,0)(0,10)(10,10)(10,0)(正方形)的多边形,给定点(1,5)将使多边形(0,0) (1,5)(0,10)(10,10)(10,0) 提前致谢 问题答案: 扩展@normaloci

