
可以动画多边形填充使用gganimate在R?

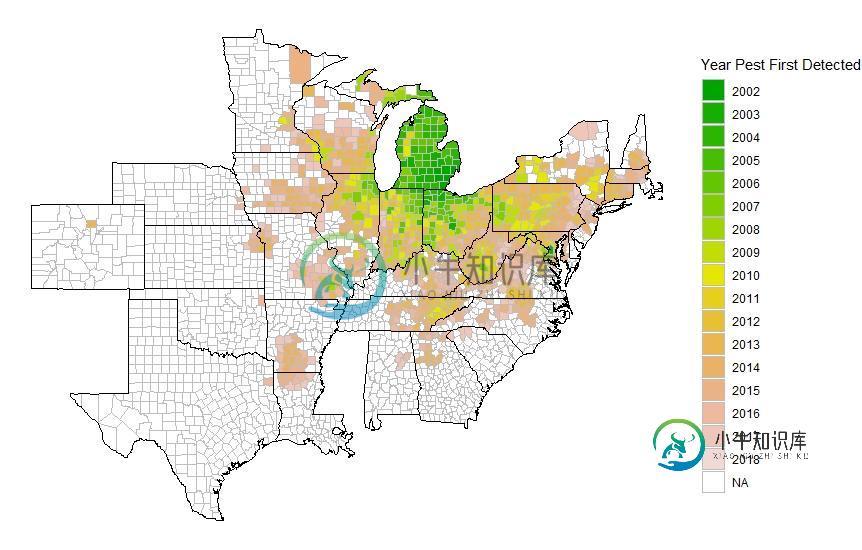
**有没有办法使用gganimate包对此地图进行动画处理,其中第一帧仅填充检测日期为2002年的多边形,第二帧填充的多边形,检测日期为2003年或更早(因此为2002年和2003年),第三帧用于检测日期为2004年或更早(2002年,2003年, 2004年),等等?**澄清:我希望所有县多边形始终可见,并且最初用白色填充,并且动画的每个帧都会根据检测年份添加县的填充。
我尝试使用transition_reveal(data$detect_year)与静态绘图,但得到一个错误,沿数据必须是整数,数字,POSIXct,日期,离散时间,欧姆。
下面是一些可复制示例的代码:
library(dplyr)
library(purrr)
library(maps)
library(ggplot2)
library(gganimate)
# Reproducible example
set.seed(42)
map_df <- map_data("county") %>%
   filter(region == "minnesota")
map_df$detection_year <- NA
# Add random detection year to each county
years <- 2002:2006
map_list <- split(map_df, f = map_df$subregion)
map_list <- map(map_list, function(.x) {
   .x$detection_years <- mutate(.x, detection_years = sample(years, 1))
})
# collapse list back to data frame
map_df <- bind_rows(map_list)
map_df$detection_years <- as.factor(map_df$detection_years)

# Make plot
static_plot <- ggplot(map_df,
                      aes(x = long,
                          y = lat,
                          group = group)) +
   geom_polygon(data = map_df, color = "black", aes(fill = detection_years)) +
   scale_fill_manual(values = terrain.colors(n = length(unique(map_df$detection_years))),
                     name = "Year EAB First Detected") +
   theme_void() +
   coord_fixed(1.3)

animate_plot <- static_plot +
   transition_reveal(detection_years)
如果有可能用gganimate做到这一点,我很乐意,但如果有人有想法,我也愿意接受其他解决方案。
共有2个答案

这可能是这样,但我不确定这是否是预期的输出。
我更改了你的代码,可能你不需要拆分。我用group_by为每个地区分配一年。
set.seed(42)
years <- 2002:2006

map_df <- map_data("county") %>%
  filter(region == "minnesota")

map_df <- map_df %>%
  group_by(subregion) %>%
  mutate(detection_year = sample(years,1))
对于过渡,您需要定义id,这里与分组相同(次区域或组)和过渡的正确日期格式(沿)变量(我使用lubriate::年())
# Make plot
static_plot <- ggplot(map_df,
                      aes(x = long,
                          y = lat,
                          group = group)) +
  geom_polygon(color = "black", aes(fill = as.factor(detection_year))) +
  scale_fill_manual(values = terrain.colors(n = length(unique(map_df$detection_year))),
                    name = "Year EAB First Detected") +
  theme_void() +
  coord_fixed(1.3)

animate_plot <- static_plot +
  transition_reveal(subregion, # same as the group variable
                    lubridate::year(paste0(detection_year, "-01-01"))) # move along years
这个对你有用吗?

在从@RLave那里得到答案后,几乎做到了我想要的,并花了一点时间在文档上,我能够找到一种方法来做我想做的事情。它看起来不是很干净,但它有效。
实际上,我为动画中需要帧的每一年创建了一个数据帧副本。然后,对于我想要制作动画的每一年的检测,我编辑该数据框副本中的< code>detection_year变量,以便在感兴趣的年份或更早的年份进行检测的任何县都保留其值,而尚未进行检测的任何县都转换为我绘制为白色的值。这确保了所有的县总是被标绘。然后,我需要使用< code>transition_manual以及我给原始数据帧的每个副本的唯一ID来确定动画的顺序。
library(dplyr)
library(purrr)
library(maps)
library(ggplot2)
library(gganimate)
# Reproducible example
set.seed(42)
years <- 2002:2006

map_df <- map_data("county") %>%
   filter(region == "minnesota")

map_df <- map_df %>%
   group_by(subregion) %>%
   mutate(detection_year = sample(years,1))

animate_data <- data.frame()
for(i in 2002:2006){
   temp_dat <- map_df %>%
      mutate(detection_year = as.numeric(as.character(detection_year))) %>%
      mutate(detection_year = case_when(
         detection_year <= i ~ detection_year,
         detection_year > i ~ 2001
      ),
      animate_id = i - 2001
      )
   animate_data <- bind_rows(animate_data, temp_dat)
}

animate_data$detection_year <- as.factor(as.character(animate_data$detection_year))

# Make plot
static_plot <- ggplot(animate_data,
                      aes(x = long,
                          y = lat,
                          group = group)) +
   geom_polygon(data = animate_data, color = "black", aes(fill = detection_year)) +
   scale_fill_manual(values = c("white",
                                terrain.colors(n = 5)),
                     name = "Year First Detected") +
   theme_void() +
   coord_fixed(1.3) #+
   facet_wrap(~animate_id)

animate_plot <- static_plot +
   transition_manual(frames = animate_id)
animate_plot
-
我可以在Google地图中绘制多边形。现在,当我在地图上绘制完该区域的多边形时,我想用相同的图标填充该多边形。我可以用颜色填充多边形,但我想用边框有一些填充和图标之间有一些指定空间的图标填充它。我该怎么做?
-
void fl_xyline(int x, int y, int x1) void fl_xyline(int x, int y, int x1, int y2) void fl_xyline(int x, int y, int x1, int y2, int x3) 先画一条水平的线,再画一条垂直的线条,最后画一条水平线 void fl_yxline(int x, int y, int y1)
-
问题内容: 有人可以诊断我面临的问题吗?在运行演示时,您可以看到中间部分为空白,我需要填充整个区域。 提前谢谢了 问题答案: 多边形与自身相交。fillPolygon方法无法清楚地确定哪个点在哪个点以及哪个点在哪个点之外。从fillPolygon javadoc: 多边形内部的区域是使用偶数填充规则(也称为交替规则)定义的。 也许您可以将多边形分成三个单个的多边形。
-
我有一个包含两个多边形的SVG。我想动画的第一个多边形从头到尾和动画的第二个多边形之后。动画将像填充一样工作。 所以我要找的输出是,动画从M的左下方开始,到右下方结束。任何帮助都将不胜感激。
-
我正在寻找一种方法来创建一组多边形(rechtangles),沿着一条线在多个多边形中创建一组多边形(rechtangles),并将其水平隔开,如图所示。 我尝试生成点并将其用作多边形的中点,但问题是,通过创建等间距的点光栅,除了180度之外,不可能以任何其他方向旋转。 例子 给出了一个多多边形形状的对象和由宽度和高度以及每个多边形之间的垂直和水平间距定义的多边形。多边形应仅放置在多多边形内,且不
-
我有一个箭头头的路径,我想做一个颜色过渡动画,从左到右。 我已经为线和箭头做了这件事,但它似乎不是同步的。我希望线和箭头都过渡颜色无缝。 CSS