
报告实验室中矩阵上的不完整刻度标记

我正在使用reportlab和matplotlib创建包含绘图的pdf文档,最近遇到了一个问题,我似乎无法使x轴刻度标签与简单的“并排”条形图上的数据正确对齐。
这份文件很长,而且很复杂,所以我已经把它剥离回要点。希望我已经把它缩减到一个最小的完整和可验证的例子。
我摘录的代码如下:
#!/usr/bin/env python3

import numpy as np
import reportlab.lib, reportlab.platypus
from reportlab.lib.pagesizes import A4
from reportlab.lib.styles import getSampleStyleSheet, ParagraphStyle
from reportlab.lib.units import mm, inch, cm
from reportlab.pdfgen import canvas
import matplotlib.pyplot as plt
from io import BytesIO

class flowable(reportlab.platypus.Flowable):
    def __init__(self, imgdata):
        reportlab.platypus.Flowable.__init__(self)
        self.img = reportlab.lib.utils.ImageReader(imgdata)

    def draw(self):
        self.canv.drawImage(self.img, 0, 0, height = -4.5*inch, width=7*inch)

class LetterMaker(object):
    """"""

    #----------------------------------------------------------------------

    def __init__(self, pdf_file):
        self.c = canvas.Canvas(pdf_file, pagesize=A4)
        self.styles = getSampleStyleSheet()
        self.width, self.height = A4

    #----------------------------------------------------------------------
    def createDocument(self):
        """"""
        rx = [14, 44, 16, 155, 214, 187, 222, 405, 314, 199]
        tx = [56, 92, 103, 28, 22, 12, 24, 75, 20, 15]
        dates = [4, 5, 6, 7, 8, 9, 10, 11, 12, 13]
        labels = ['a', 'b', 'c', 'd', 'e', 'f', 'g', 'h', 'i', 'j']
        fig = plt.figure()
        ax = fig.add_subplot(1, 1, 1) # nrows, ncols, index
        indices = np.arange(len(dates))
        bar_width = np.min(np.diff(indices))/3.
        ax.axes.set_xticklabels(labels)
        plt.bar(indices-bar_width/2, rx, bar_width)
        plt.bar(indices+bar_width/2, tx, bar_width)
        imgdata = BytesIO()
        fig.savefig(imgdata, format='png', edgecolor='#79b85f', facecolor=fig.get_facecolor())
        imgdata.seek(0)  # rewind the data

        pic = flowable(imgdata)
        pic.wrapOn(self.c, self.width, self.height)
        pic.drawOn(self.c, *self.coord( 2, 14, cm))


    def coord(self, x, y, unit=1):
        x, y = x * unit, self.height -  y * unit
        return x, y

    def savePDF(self):
        """"""
        self.c.save()

if __name__ == "__main__":
    doc = LetterMaker("testfile.pdf")
    doc.createDocument()
    doc.savePDF()
当我运行这段代码时,结果图如下所示:
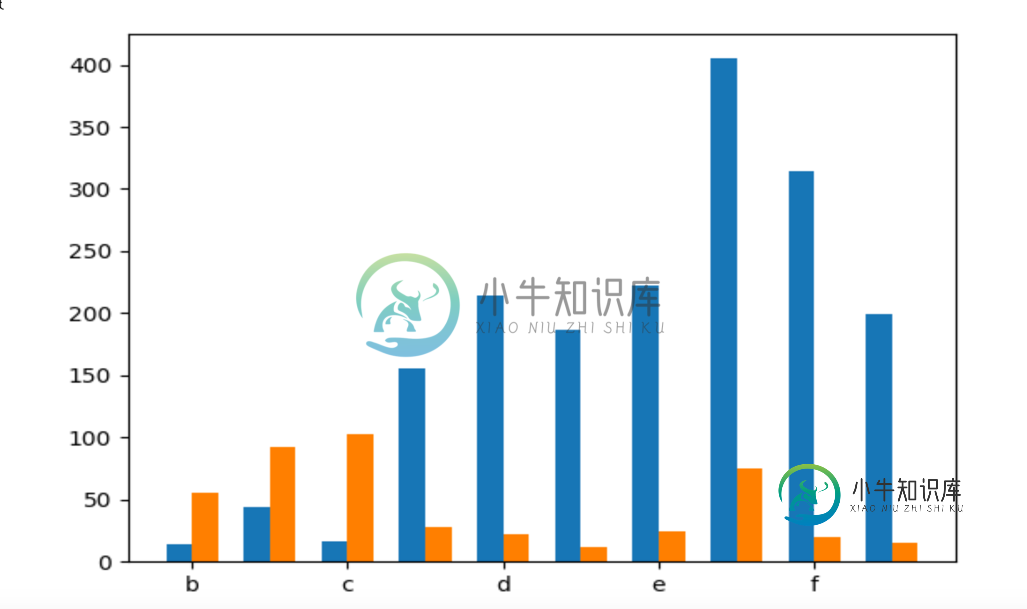
我无法解释为什么x轴标签没有按照标签列表遵循完整的集合。
最初,日期数据是整数列表。
我怀疑matplotlib试图提供帮助并将数值数据拟合到范围内,但只找到两个列表的相交,因此我将其作为字符串列表提供,但问题仍然存在。
我在网上到处寻找相关的线索,但似乎找不到任何直接相关的东西。
我使用以下资源作为编写代码的指导,也作为故障排除帮助:
报告实验室:混合固定内容和可流动内容
api示例代码:barchartdemo.py
我还用这个SO问题作为指导
如何并排绘制具有相同X坐标的条形图(“躲开”)
有人能解释一下为什么会这样吗?
编辑
根据@Paul H的评论,我去掉了reportlab代码,仍然得到相同的结果。
更新代码如下:
#!/usr/bin/env python3

import matplotlib.pyplot as plt
import numpy as np

rx = [14, 44, 16, 155, 214, 187, 222, 405, 314, 199]
tx = [56, 92, 103, 28, 22, 12, 24, 75, 20, 15]
dates = [0, 1, 2, 3, 4, 5, 6, 7, 8, 9]
labels = ['a', 'b', 'c', 'd', 'e', 'f', 'g', 'h', 'i', 'j']
fig = plt.figure()
ax = fig.add_subplot(1, 1, 1) # nrows, ncols, index
indices = np.arange(len(dates))
bar_width = np.min(np.diff(indices))/3.
ax.axes.set_xticklabels(labels)
plt.bar(indices-bar_width/2, rx, bar_width)
plt.bar(indices+bar_width/2, tx, bar_width)
fig.savefig('plot.png')
结果还是一样。
共有1个答案

我认为您希望在这里使用matplotlib ticker和locator功能,它有助于计算未使用/不可标记的x值。
首先,您要设置定位器,用标记每个整数ax.xaxis.set_major_locator(plt.MultipleLocator(1))
然后将格式化程序设置为FuncFormatter,并传入一个接受x值并计算/查找x标签的函数。
import matplotlib.pyplot as plt
import numpy as np

rx = [14, 44, 16, 155, 214, 187, 222, 405, 314, 199]
tx = [56, 92, 103, 28, 22, 12, 24, 75, 20, 15]
dates = [0, 1, 2, 3, 4, 5, 6, 7, 8, 9]
labels = ['a', 'b', 'c', 'd', 'e', 'f', 'g', 'h', 'i', 'j']
fig = plt.figure()
ax = fig.add_subplot(1, 1, 1) # nrows, ncols, index
indices = np.arange(len(dates))
bar_width = np.min(np.diff(indices))/3.
ax.bar(indices-bar_width/2, rx, bar_width)
ax.bar(indices+bar_width/2, tx, bar_width)


@plt.FuncFormatter
def ticks(x, pos):
    try:
        return labels[int(x)]
    except IndexError:
        return ''

ax.xaxis.set_major_locator(plt.MultipleLocator(1))
ax.xaxis.set_major_formatter(ticks)
-
实验报告要求 从git server网站上取得ucore_lab后,进入目录labcodes/lab8,完成实验要求的各个练习。在实验报告中回答所有练习中提出的问题。在目录labcodes/lab8下存放实验报告,实验报告文档命名为lab8-学堂在线ID.md。推荐用markdown格式。对于lab8中编程任务,完成编写之后,再通过git push命令把代码同步回git server网站。最后请一
-
实验报告要求 从git server网站上取得ucore_lab后,进入目录labcodes/lab7,完成实验要求的各个练习。在实验报告中回答所有练习中提出的问题。在目录labcodes/lab7下存放实验报告,实验报告文档命名为lab7-学堂在线ID.md。推荐用markdown格式。对于lab7中编程任务,完成编写之后,再通过git push命令把代码同步回git server网站。最后请一
-
实验报告要求 从git server网站上取得ucore_lab后,进入目录labcodes/lab6,完成实验要求的各个练习。在实验报告中回答所有练习中提出的问题。在目录labcodes/lab6下存放实验报告,实验报告文档命名为lab6-学堂在线ID.md。推荐用markdown格式。对于lab6中编程任务,完成编写之后,再通过git push命令把代码同步回git server网站。最后请一
-
实验报告要求 从git server网站上取得ucore_lab后,进入目录labcodes/lab5,完成实验要求的各个练习。在实验报告中回答所有练习中提出的问题。在目录labcodes/lab5下存放实验报告,实验报告文档命名为lab5-学生ID.md。推荐用markdown格式。对于lab5中编程任务,完成编写之后,再通过git push命令把代码同步回git server网站。最后请一定提
-
实验报告要求 从git server网站上取得ucore_lab后,进入目录labcodes/lab4,完成实验要求的各个练习。在实验报告中回答所有练习中提出的问题。在目录labcodes/lab4下存放实验报告,实验报告文档命名为lab4-学生ID.md。推荐用markdown格式。对于lab4中编程任务,完成编写之后,再通过git push命令把代码同步回git server网站。最后请一定提
-
实验报告要求 从git server网站上取得ucore_lab后,进入目录labcodes/lab3,完成实验要求的各个练习。在实验报告中回答所有练习中提出的问题。在目录labcodes/lab3下存放实验报告,实验报告文档命名为lab3-学生ID.md。推荐用markdown格式。对于lab3中编程任务,完成编写之后,再通过git push命令把代码同步回git server网站。最后请一定提