
在Python中绘制椭圆轨道(使用numpy,matplotlib)

我想知道如何通过使用方程ay 2 + bxy + cx + dy + e = x 2来绘制椭圆轨道吗?
我首先确定了a,b,c,d,e常数,现在我假设通过给定x值,我将获得y,这将给我想要的图形,但我不能通过使用matplotlib来完成。
如果您能帮助我,我将不胜感激!
编辑:我在这里添加了代码。
from numpy import linalg
from numpy import linspace
import numpy as np
from numpy import meshgrid
import random
import matplotlib.pyplot as plt
from scipy import optimize

x = [1.02, 0.95, 0.87, 0.77, 0.67, 0.56, 0.44, 0.30, 0.16, 0.01]
y = [0.39, 0.32, 0.27, 0.22, 0.18, 0.15, 0.13, 0.12, 0.12, 0.15]

my_list = [] #It is the main list.
b = [0] * len(x) # That is the list that contains the results that are given as x^2 from the equation.

def fxn():  # That is the function that solves the given equation to find each parameter.
    global my_list
    global b
    for z in range(len(x)):
        w = [0] * 5
        w[0] = y[z] ** 2
        w[1] = x[z] * y[z]
        w[2] = x[z]
        w[3] = y[z]
        w[4] = 1
        my_list.append(w)
        b[z] = x[z] ** 2

    t = linalg.lstsq(my_list, b)[0]
    print 'List of list representation is', my_list
    print 'x^2, the result of the given equation is', b
    print '\nThe list that contains the parameters is', t

fxn()
t = linalg.lstsq(my_list, b)[0]

print '\nThe constant a is', t[0]
print 'The constant b is', t[1]
print 'The constant c is', t[2]
print 'The constant d is', t[3]
print 'The constant e is', t[4]
编辑:这是常量值:
a = -4.10267300566
b = 1.10642410023
c = 0.39735696603
d = 3.05101004127
e = -0.370426134994
问题答案:
可以解决y作为x的函数的问题
问题是每个有效x都有y的2个值,并且在椭圆跨度x的范围之外没有(或虚数)y个解
下面是3.5代码,sympy 1.0应该可以,但是可以打印,列表组合可能无法向后兼容2.x
from numpy import linalg
from numpy import linspace
import numpy as np
from numpy import meshgrid
import random
import matplotlib.pyplot as plt
from scipy import optimize
from sympy import *

xs = [1.02, 0.95, 0.87, 0.77, 0.67, 0.56, 0.44, 0.30, 0.16, 0.01]
ys = [0.39, 0.32, 0.27, 0.22, 0.18, 0.15, 0.13, 0.12, 0.12, 0.15]

b = [i ** 2 for i in xs] # That is the list that contains the results that are given as x^2 from the equation.

def fxn(x, y):  # That is the function that solves the given equation to find each parameter.
    my_list = [] #It is the main list.
    for z in range(len(x)):
        w = [0] * 5
        w[0] = y[z] ** 2
        w[1] = x[z] * y[z]
        w[2] = x[z]
        w[3] = y[z]
        w[4] = 1
        my_list.append(w)
    return my_list

t = linalg.lstsq(fxn(xs, ys), b)


def ysolv(coeffs):
    x,y,a,b,c,d,e = symbols('x y a b c d e')
    ellipse = a*y**2 + b*x*y + c*x + d*y + e - x**2
    y_sols = solve(ellipse, y)
    print(*y_sols, sep='\n')

    num_coefs = [(a, f) for a, f in (zip([a,b,c,d,e], coeffs))]
    y_solsf0 = y_sols[0].subs(num_coefs)
    y_solsf1 = y_sols[1].subs(num_coefs)

    f0 = lambdify([x], y_solsf0)
    f1 = lambdify([x], y_solsf1)
    return f0, f1

f0, f1 = ysolv(t[0])

y0 = [f0(x) for x in xs]
y1 = [f1(x) for x in xs]

plt.scatter(xs, ys)
plt.scatter(xs, y0, s=100, color = 'red', marker='+')
plt.scatter(xs, y1, s=100, color = 'green', marker='+')
plt.show()
在Spyder中运行以上命令时:
runfile('C:/Users/john/mypy/mySE_answers/ellipse.py', wdir='C:/Users/john/mypy/mySE_answers')
(-b*x - d + sqrt(-4*a*c*x - 4*a*e + 4*a*x**2 + b**2*x**2 + 2*b*d*x + d**2))/(2*a)
-(b*x + d + sqrt(-4*a*c*x - 4*a*e + 4*a*x**2 + b**2*x**2 + 2*b*d*x + d**2))/(2*a)
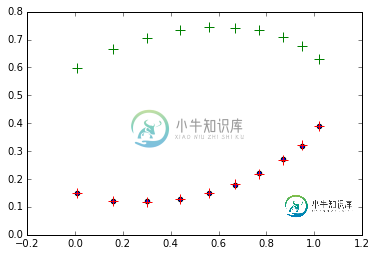
为y值生成的函数并非在所有地方都有效:
f0(0.1), f1(0.1)
Out[5]: (0.12952825130864626, 0.6411040771593166)

f0(2)
Traceback (most recent call last):

  File "<ipython-input-6-9ce260237dcd>", line 1, in <module>
    f0(2)

  File "<string>", line 1, in <lambda>

ValueError: math domain error


In [7]:
域错误将需要尝试/执行才能“感觉”到有效的x范围或更多数学运算
像下面的try / except一样:(编辑为“关闭”图纸,重新注释)
def feeloutXrange(f, midx, endx):
    fxs = []
    x = midx
    while True:
        try: f(x)
        except:
            break
        fxs.append(x)
        x += (endx - midx)/100
    return fxs

midx = (min(xs) + max(xs))/2

xpos = feeloutXrange(f0, midx, max(xs))
xnegs = feeloutXrange(f0, midx, min(xs))
xs_ellipse = xnegs[::-1] + xpos[1:]

y0s = [f0(x) for x in xs_ellipse]
y1s = [f1(x) for x in xs_ellipse]

ys_ellipse = y0s + y1s[::-1] + [y0s[0]] # add y start point to end to close drawing

xs_ellipse = xs_ellipse + xs_ellipse[::-1] + [xs_ellipse[0]] # added x start point


plt.scatter(xs, ys)
plt.scatter(xs, y0, s=100, color = 'red', marker='+')
plt.scatter(xs, y1, s=100, color = 'green', marker='+')
plt.plot(xs_ellipse, ys_ellipse)
plt.show()
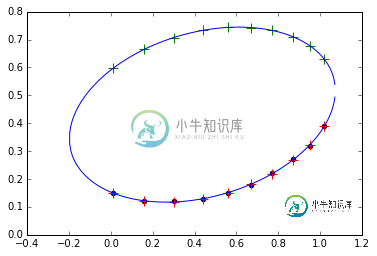
编辑:将重复的起点添加到椭圆点列表的末尾以关闭绘图
ys_ellipse = y0s + y1s[::-1] + [y0s[0]] # add y start point to end to close drawing

xs_ellipse = xs_ellipse + xs_ellipse[::-1] + [xs_ellipse[0]] # added x start point

-
主要内容:示例可以使用类的方法在图像上绘制椭圆形。 以下是这种方法的语法 - 该方法接受以下参数 - mat - 表示要在其上绘制矩形的图像的对象。 pt1 和 pt2 - 两个对象,表示要绘制的矩形的顶点。 color - 表示矩形颜色的标量对象(BGR)。 thickness - 表示矩形厚度的整数; 默认情况下,厚度值为。 类的构造函数接受类的对象,Size类的对象和double类型的变量,如下所示。 示
-
本文向大家介绍python+matplotlib绘制旋转椭圆实例代码,包括了python+matplotlib绘制旋转椭圆实例代码的使用技巧和注意事项,需要的朋友参考一下 旋转椭圆 实例代码: 总结 以上就是本文关于python+matplotlib绘制旋转椭圆实例代码的全部内容,希望对大家有所帮助。感兴趣的朋友可以继续参阅本站其他相关专题,如有不足之处,欢迎留言指出。感谢朋友们对本站的支持!
-
本文向大家介绍C#绘制椭圆的方法,包括了C#绘制椭圆的方法的使用技巧和注意事项,需要的朋友参考一下 本文实例讲述了C#绘制椭圆的方法。分享给大家供大家参考。具体实现方法如下: 希望本文所述对大家的C#程序设计有所帮助。
-
问题内容: 似乎没有绘制椭圆形形状的本机功能。我也不是在寻找蛋形。 是否可以绘制具有2个贝塞尔曲线的椭圆形?有人遇到过吗? 我的目的是画一些眼睛,实际上我只是使用弧线。提前致谢。 解 因此,scale()更改所有下一个形状的缩放比例。Save()之前保存设置,还原用于还原设置以绘制新形状而无需缩放。 感谢Jani 问题答案: 更新: 缩放方法可能会影响笔触宽度的外观 正确的缩放方法可以保持笔画宽度
-
我正在尝试生成随机大小的椭圆,并将其绘制到地图上(只是一个二维瓷砖阵列)。在大多数情况下,这是可行的,然而,当房间比它更宽时,它似乎会切断墙角。 下面是我绘制椭圆的代码。基本上是取一个矩形并在其中绘制椭圆。 我这样称呼这种方法。在随机位置生成随机大小的矩形,然后创建墙砖的椭圆,然后用地砖覆盖内侧墙砖。 还有一个额外的问题,有人知道我怎么才能不把1块瓷砖放在椭圆的顶部/底部吗?
-
问题内容: 有人有绘制椭球体的样例代码吗?球体有一个 在“matplotlib”网站上,但椭球体没有。我正试图策划 其中“c”是定义椭球体的常量(如10)。我试过了 route,修改了公式,使’z’在一边,但是 `sqrt是个问题。“matplotlib”球体示例适用于角度“u,v”, 但我不知道如何计算椭球体。 问题答案: 下面是如何通过球坐标实现的: 上面的程序实际上生成了一个更好看的“正方形