Chapter 3 Advanced Drawing and Events
Image Fills
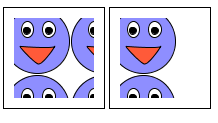
In Chapter 1 we learned that Canvas can fill shapes with colors and gradients. You can also fill shapes with images by defining a pattern. You can control how the pattern is repeated the same as you would with background images in CSS.
var img = new Image();
img.onload = function() {

    var canvas = document.getElementById('can');
    var c = canvas.getContext('2d');
    var pat = c.createPattern(img,'repeat');
    c.fillStyle = pat;
    c.fillRect(10,10,80,80);

    var canvas2 = document.getElementById('can2');
    var c2 = canvas2.getContext('2d');
    var pat2 = c2.createPattern(img,'repeat-y');
    c2.fillStyle = pat2;
    c2.fillRect(10,10,80,80);

}
img.src = 'smile.png';
As with gradients, the pattern is drawn relative to the current coordinate system. That's why I had to translate by 200 pixels to the right before drawing the second rectangle. Since it doesn't repeat in the X direction, only y, making the filled area bigger won't actually draw more of the pattern. Try dragging the values around to see how it works.

var pat1 = ctx.createPattern(img,'repeat');
ctx.fillStyle = pat1;
ctx.fillRect(0,0,100,100);

var pat2 = ctx.createPattern(img,'repeat-y');
ctx.fillStyle = pat2;
ctx.translate(200,0);
ctx.fillRect(0,0,100,100);
Note that filling with an image texture only works if the image has already been loaded, so be sure to do the drawing from the image's onload callback.
Opacity
The Canvas API lets you control the opacity of any drawing function with the globalAlpha property. This next demo draws two red squares overlapping with the background showing through by changing the globalAlpha before each drawing operation.

ctx.fillStyle = 'red';
//divide by 100 to get a fraction between 0 and 1
ctx.globalAlpha = 50/100;
ctx.fillRect(0,0,50,50);
ctx.globalAlpha = 30/100;
ctx.fillRect(25,25,50,50);
ctx.globalAlpha = 1.0;
This opacity setting works with all drawing operations. Try changing the opacity values above to see the effect. Be sure to set it back to 1.0 when you are done so that it won't affect later drawing. The globalAlpha property must be a value between 0 and 1 or else it will be ignored (or may unexpected behavior on some platforms).
Transforms
In the bar chart chapter we drew the same rectangle over and over again just with different x and y coordinates. Rather than modifying those coordinates we could have used a translate function. Each time through the loop we can translate by an additional 100 pixels to move the next bar over to the right.

ctx.fillStyle = "red";
for(var i=0; i<data.length; i++) {
    var dp = data[i];
    ctx.translate(100, 0);
    ctx.fillRect(0,0,50,dp);
}
Try dragging the x translate variable to see how the effect combines across the chart.
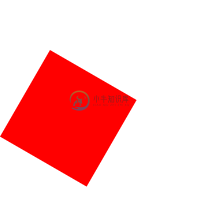
Like many 2D APIs, Canvas has support for the standard translate, rotate, and scale transforms. This lets you draw shapes transformed around on the screen without having to calculate new points by hand. Canvas does the math for you. You can also combine transforms by calling them in order. For example, to draw a rectangle translated to the center and then rotated by 30 degrees you would do this:

ctx.fillStyle = "red";
ctx.translate(50,50);
//convert degrees to radians
var rads = 30 * Math.PI*2.0/360.0;
ctx.rotate(rads)
ctx.fillRect(0,0,100,100);
Each time you call translate, rotate, or scale it adds on to the previous transformation. Over time this could get confusing, of course. You could undo the transforms like this:
for(var i=0; i<data.length; i++) {
    c.translate(40+i*100, 460-dp*4);
    var dp = data[i];
    c.fillRect(0,0,50,dp*4);
    c.translate(-40-i*100, -450+dp*4);
}
but that's a lot of annoying code to write. If you forget to undo it just once then you could be screwed and spend hours looking through your code for that one bug. (not that I've ever done that, of course!) Instead Canvas provides a state saving API.
State Saving
The context2D object represents the current drawing state. In this book I always use the ctx variable to hold this context. The state includes the current transform, the fill and stroke colors, the current font, and a few other variables. You can save this state by pushing it onto a stack using the save() function. After you save the state you can make modifications, then restore to the previous state with the restore() function. Canvas takes care of the book-keeping for you. Here is the previous example written with state saving instead. Notice that we don't have to do the un-translation step.
for(var i=0; i<data.length; i++) {
    c.save();
    c.translate(40+i*100, 460-dp*4);
    var dp = data[i];
    c.fillRect(0,0,50,dp*4);
    c.restore();
}
Clipping
Sometimes you may want to draw just part of a shape. You can do this with the clip function. It takes the current shape and uses it as a mask for further drawing. This means that any drawing will only happen inside of the clip. Anything you draw outside of the clip will not be shown on screen. This can be useful for when you want to create a complex graphic by combining shapes, or when you want to update just a part of the screen for performance reasons. Here's an example where we draw a bunch of squares clipped by a circle:
c.strokeStyle = "black";
c.lineWidth = 10;
c.fillStyle = "red";

// draw rect the first time
c.fillRect(0,0,600,200);

c.save();

// create triangle path
c.beginPath();
c.moveTo(200,100);
c.lineTo(300,300);
c.lineTo(100,300);
c.closePath();

// stroke the triangle so we can see it
c.stroke();

// use triangle as clip, then fill rect in again with yellow
c.clip();
c.fillStyle = "yellow";
c.fillRect(0,0,600,200);
c.restore();

// draw rect the first time
ctx.fillStyle = 'red';
ctx.fillRect(0,0,400,100);

// create triangle path
ctx.beginPath();
ctx.moveTo(200,50);
ctx.lineTo(250,150);
ctx.lineTo(150,150);
ctx.closePath();

// stroke the triangle so we can see it
ctx.lineWidth = 10;
ctx.stroke();

// use triangle as clip,
ctx.clip();
//fill rect in again with yellow
ctx.fillStyle = 'yellow';
ctx.fillRect(0,0,400,100);
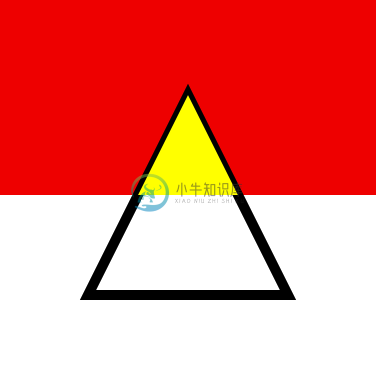
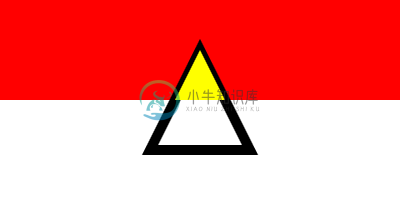
Notice how the yellow rectangle fills the intersection of the red rectangle and the triangle. Also notice that the lower part of the triangle has a thick border, but the upper part has a thinner border. This is because the border is centered on the actual geometric edges of the triangle shape. The yellow covers up the inside border when it is clipped by the geometric triangle, but the outside border remains uncovered.
Events
Canvas doesn't define any new events. You can listen to the same mouse and touch events that you'd work with anywhere else. This is both good and bad.
The Canvas just looks like a rectangular area of pixels to the rest of the browser. The browser doesn't know about any shapes you've drawn. If you drag your mouse cursor over the canvas then the browser will send you standard drag events to the canvas as a whole, not to anything within the canvas. This means that if you want to do special things like making buttons or a drawing tool you will have to do the event processing yourself by converting the raw mouse events that the browser gives you to your own data model.
Calculating which shape is under the mouse cursor could be very difficult. Fortunately Canvas has an API to help: isPointInPath. This function will tell you if a given coordinate is inside of the current path. Here's a quick example:
c.beginPath();
c.arc(
    100,100, 40,  //40 pix radius circle at 100,100
    0,Math.PI*2,  //0 to 360 degrees for a full circle
);
c.closePath();
var a = c.isPointInPath(80,0);     // returns true
var b = c.isPointInPath(200,100);  // returns false
Another option is to use a scenegraph library such as Amino which lets you work in terms of shapes instead of pixels. It will handle event processing and repaints for you.

