
Ember Google Charts
Ember Google Charts makes it very easy to implement Google Charts in Ember CLI apps.
All dependencies are lazy loaded using the Google JS API Loader, which intelligently caches requests between a user's sessions.
Installation
ember install ember-google-charts
See the demo app here.
Usage
Charts
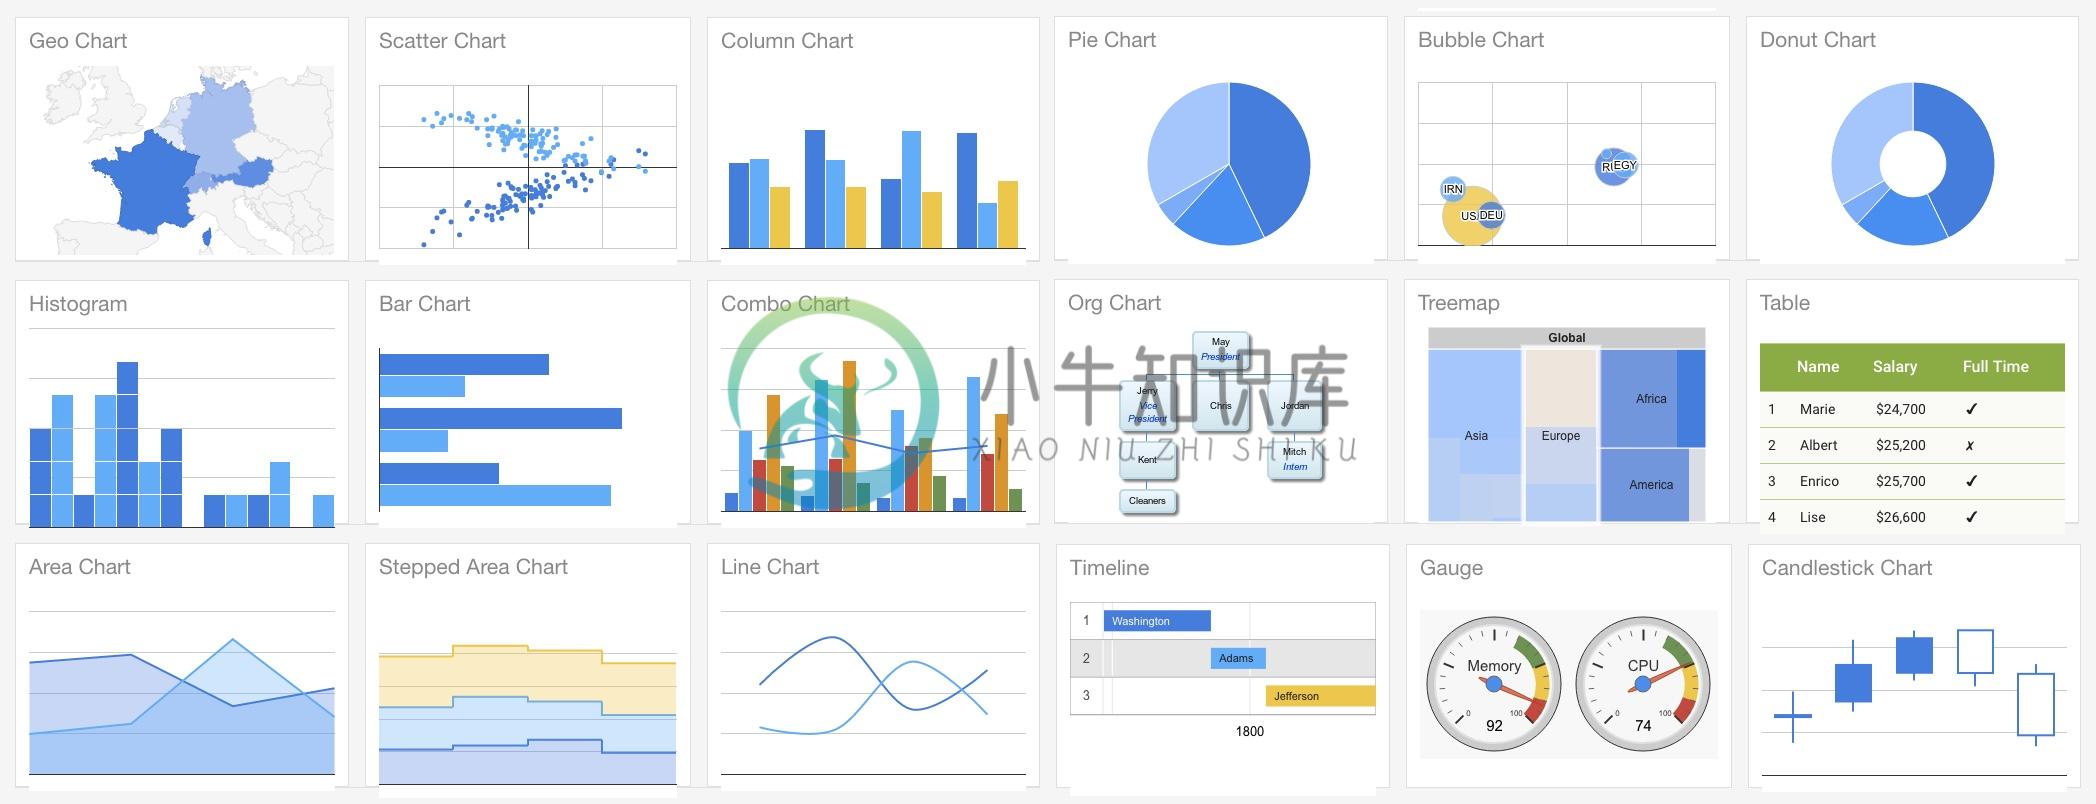
There are six types of chart supported out of the box:
- Area Charts (
{{area-chart}}) - Bar Charts (
{{bar-chart}}) - Geo Charts (
{{geo-chart}}) - Line Charts (
{{line-chart}}) - Pie Charts (
{{pie-chart}}) - Scatter Charts (
{{scatter-chart}})
To add a chart to any route, simply add the relevant component:
Or if you're using an old template syntax:
Data and options should be in the format expected by the given chart, as detailed in the Google Charts documentation.
For example:
/* stats/route.js */

import Route from '@ember/routing/route';

export default Route.extend({

  model() {
    return [
      ['Task', 'Hours per Day'],
      ['Work', 11],
      ['Eat', 2],
      ['Commute', 2],
      ['Watch TV', 2],
      ['Sleep', 7],
    ];
  },

});
/* stats/controller.js */

import Controller from '@ember/controller';

export default Controller.extend({

  options: {
    title: 'How I spend my days',
    height: 300,
    width: 400,

    animation: {
      startup: true,
      easing: 'inAndOut',
    },
  },

});
You can pass data as an array (see above example) or as a Google Data Table:
/* stats/route.js */

import Route from '@ember/routing/route';

export default Route.extend({

  model() {
    return google.visualization.arrayToDataTable([
      ['Year', 'Sales', 'Expenses'],
      ['2004', 1000, 400],
      ['2005', 1170, 460],
    ], false);
  },

});
For more information about data tables and how to create them, see the Google Charts guides.
Where possible, this addon default to using Material Charts over Google's 'classic' design.
It's very easy to add non-default charts (e.g. table charts or gauge charts) - see the custom charts docs here
Design
Indicate which design you want: classic or material.
Only some chart types support Material Charts. See the Google Charts documentation Chart Types to learn more.
Default Options
Default options for all charts can be set in the GoogleChartsService.
Default options are always merged with the options you pass into a component. Passed in options will only override specific options properties, not the whole options object.
/* services/google-charts.js */

import GoogleChartsService from 'ember-google-charts/services/google-charts';

export default GoogleChartsService.extend({

  defaultOptions: {
    backgroundColor: '#389fcc',
    annotations: {
      alwaysOutside: true,
    },
  },

});
You can also set default options for individual components by overriding defaultOptions for the component. For example, if you want a custom chart component to use different default options:
/* components/gantt-chart.js */

import GoogleChart from 'ember-google-charts/components/google-chart';
import renderMaterialChart from 'ember-google-charts/utils/render-material-chart';

export default GoogleChart.extend({
  type: 'gantt',

  defaultOptions: {
    backgroundColor: '#389fcc',
    annotations: {
      alwaysOutside: true,
    },
  },

  renderChart: renderMaterialChart,
});
Locales
You can set the language of the charts you render by specifying the language code in the google-charts service:
/* services/google-charts.js */

import GoogleChartsService from 'ember-google-charts/services/google-charts';

export GoogleChartsService.extend({
  language: 'fr',
});
For more information on locales, see the Google Charts documentation.
Please note, Google Charts dependencies can only be loaded for a single language. This is a limitation of the Google API loader.
Resize
By default charts will rerender when the window size changes. You can opt out of this by setting responsiveResize to false:
Actions
Two actions are available for you to hook on to:
chartDidRender()
This fires when the Google chart has rendered and is ready for interaction via Google Charts public methods.
This action receives the chart object of the rendered chart.
/* stats/controller.js */

import Controller from '@ember/controller';

export default Controller.extend({

  actions: {
    selectCountry(chart) {
      chart.setSelection('someValue');
    },
  },

});
packagesDidLoad()
This fires when the Google chart has finished loading the required Google packages for a specific chart.
This action receives no params.
/* stats/controller.js */

import Controller from '@ember/controller';

export default Controller.extend({

  actions: {
    checkGoogleExists() {
      if (window.google) {
        // Do something...
      }
    },
  },

});
Events
It's easy to listen to events emitted by a chart:
/* stats/controller.js */

import Controller from '@ember/controller';

export default Controller.extend({

  actions: {
    addChartEventListeners(chart) {
      const { google: { visualization } } = window;

      visualization.events.addListener(chart, 'onmouseover', function(event) {
        /* Do something here... */;
      });
    }
  },

});
For more information on events, see the Google Charts event documentation.
Custom Charts
All chart components in this addon extend from a single core component: the GoogleChartComponent.
- Find the type of chart in the Google guides and see what Google Charts package it requires
- Update the Google Chart service
packagesproperty with the new Google Charts package you require (if applicable) - Specify whether to use
'material'or'classic'design (depending on what Google Charts documentation says the chart type supports)
/* components/gantt-chart.js */

import GoogleChart from 'ember-google-charts/components/google-chart';

export default GoogleChart.extend({
  design: 'classic',
  type: 'gantt',
});
/* services/google-charts.js */

import GoogleChartsService from 'ember-google-charts/services/google-charts';

export GoogleChartsService.extend({
  googlePackages: ['corechart', 'bar', 'line', 'scatter', 'gantt'], // Added gantt to defaults
});
If preferred, you can write your own renderChart method. Use the renderChart util as your guide.
renderChart() receives the DOM Element in which to render the chart followed by the chart properties, which is an object that should include the following properties:
data(see usage instructions)design('material'or'classic')options(see usage instructions)type(e.g.'bar','line', etc)
renderChart() must return a promise that resolves with the chart object (resolve(chart)).
Content Security Policy
You will need to add the following to your app's content security policy to mitigate CSP errors:
contentSecurityPolicy: {
  'script-src': "'self' 'unsafe-eval' *.google.com *.gstatic.com",
  'style-src': "'self' 'unsafe-inline' *.google.com *.googleapis.com *.gstatic.com",
  'font-src': "'self' *.gstatic.com *.googleapis.com",
}
Testing
This addon makes two test helpers available that you can use in your app's test suite:
renderChart()assertChart()
renderChart()
renderChart() is an async helper that renders a chart using @ember/test-helpers's render() method.
You must pass in an ES6 tagged template string, as is expected by render(), documented here, so this helper is designed for use in integration tests.
For convenience, renderChart() returns the chart's DOM element.
For example:
/* tests/integration/some-test */

import { module } from 'qunit';
import { setupRenderingTest } from 'ember-qunit';
import { renderChart } from 'ember-google-charts/test-support';

module('Integration | Component | pretty color', function(hooks) {
  setupRenderingTest(hooks);

  test('Rendering the expenses chart', async function(assert) {
    this.set('data', [
      ['Year', 'Sales', 'Expenses'],
      ['2004', 1000, 400],
      ['2005', 1170, 460],
      ['2006', 660, 1120],
      ['2007', 1030, 540],
    ]);

    const chart = await renderChart(hbs`{{area-chart data=data}}`);

    /* Now run some assertions... */

    assert.ok(chart.textContent.indexOf('2007') > -1,
      'Should contain 2007 data');

  });

});
renderChart() adds a delay to your test suite that can be removed if you desire (but this may fail test suites in remote environments, like Travis):
const chart = await renderChart(hbs`{{area-chart data=data}}`, {
  delay: 0, // Or some number of milliseconds
});
assertChart()
assertChart() runs a series of predefined assertions on any chart element to assert that the chart has been rendered correctly.
assertChart() expects several params to be passed:
assert, which is available in all 'ember-qunit' testschart, which is the chart's element and is returned by therenderChart()test helperproperties, which is an object that should include the properties passed into the chart component:datadesign('material'or'classic')optionstype(e.g.'bar','line', etc)
Here is an example, which also uses renderChart():
/* tests/integration/some-test */

import { module } from 'qunit';
import { setupRenderingTest } from 'ember-qunit';
import { assertChart, renderChart } from 'ember-google-charts/test-support';

module('Integration | Component | pretty color', function(hooks) {
  setupRenderingTest(hooks);

  const data = [
    ['Year', 'Sales', 'Expenses'],
    ['2004', 1000, 400],
    ['2005', 1170, 460],
    ['2006', 660, 1120],
    ['2007', 1030, 540],
  ];

  const options = {
    title: 'Yearly expenses',
    animation: {
      startup: true,
      easing: 'inAndOut',
    },
  };

  test('Rendering the expenses chart', async function(assert) {

    this.setProperties({
      data,
      options,
    });

    const chart = await renderChart(hbs`{{area-chart data=data options=options}}`);

    assertChart(assert, chart, {
      data,
      design: 'classic', // Because it's not a Material Chart
      options,
      type: 'area',
    });
  });
});
Development
All PRs and issues are welcome.
git clone https://github.com/sir-dunxalot/ember-google-charts.gitcd ember-tooltipsnpm install && bower installember sember test,ember try:testall, or the/testsroute
Please include tests and documentation updates with any new features.
You do not need to bump the version when you have a PR.
To release an update to the demo app:
git checkout master # make sure you're on master branch
ember github-pages:commit --message "Some commit message" # Builds the app
git push origin gh-pages:gh-pages # Deploys the app
-
ui.Chart.image.regions 示例设置 该ui.Chart.image.regions函数接受一个列表,允许您通过为它们分配数值来控制沿 x 轴的波段名称的标签和顺序。以下图表使用此选项将波段名称设置为月份标签,并按月平均降水量的时间顺序对它们进行排序。 柱状图 ui.Chart.image.regions(image, regions, reducer, scale, serie
-
Google Charts 除少数例外情况外,所有包含Google图表的网页都应在网页的<head>中包含以下几行: <script type="text/javascript" src="https://www.gstatic.com/charts/loader.js"></script> <script type="text/javascript"> google.charts.load(
-
到目前为止,我们所讨论的内容对于许多web页面来说已经足够了:您已经在页面上绘制了图表。但是,如果您想捕获用户单击,或者需要在已经绘制的图表中操作属性或数据,则需要侦听图表引发的事件。 所有图表都会抛出一些事件。以下是最常见的: ready-当图表被绘制在页面上并准备好响应方法时抛出。如果需要从图表中请求信息,请侦听此事件。 select—当用户选择图表上的某些内容时抛出:通常通过单击bar或pi
-
There may / must be better ways but here we go. Recipes: Headless browser component, e.g. PhantomJS [1] is the preferred case because it's 1) v8, 2) lightweight, comparing to the next choince Firefox
-
本文介绍如何监听图表的处理事件。 内容 概述 Google charts 可以创建你需要监听的事件。事件可以由用户的动作触发,例如当用户点击一个图表时。你可以注册一个Javascript方法当某些动作被触发时来调用,可以有数据来强调事件。 每个图表都定义了自己的事件,对图表的声明需要描述要调用的时间,也就是说,如何得到与时间关联的信息。这篇文章描述如何从图表注册获取事件,以及如何处理事件。 有一个
-
<html> <head> <!--Load the AJAX API--> <script type="text/javascript" src="https://www.gstatic.com/charts/loader.js"></script> <script type="text/javascript"> // Load the Visualiz
-
Ember Google Analytics Embed Ember Google Analytics Embed is an addon for quickly building custom Google Analytics dashboards in your Ember.js app, using the Google Analytics Embed API. The addon expo
-
Ember-cli-google-fonts Lazily add Google Fonts to your Ember application. This addon will add the fonts declaration to the content-for: head hook to avoid including these inside the css files. Addon d
-
Ember Charts 是个图表库,使用 Ember.js 和 d3.js 框架构建的。它包括时间线,条形图,饼图和散点图,非常容易扩展和修改。这些图表组件都是开箱即用的,在图表交互和演示方面应用的很好。
-
Ember检查器是一个浏览器插件,用于调试Ember应用程序。 灰烬检查员包括以下主题 - S.No. 灰烬检查员方式和描述 1 安装Inspector 您可以安装Ember检查器来调试您的应用程序。 2 Object Inspector Ember检查器允许与Ember对象进行交互。 3 The View Tree 视图树提供应用程序的当前状态。 4 检查路由,数据选项卡和库信息 您可以看到检查
-
英文原文: http://emberjs.com/guides/getting-ember/index/ Ember构建 Ember的发布管理团队针对Ember和Ember Data维护了不同的发布方法。 频道 最新的Ember和Ember Data的 Release,Beta 和 Canary 构建可以在这里找到。每一个频道都提供了一个开发版、最小化版和生产版。更多关于不同频道的信息可以查看博客
-
ember-emojione ember-emojione is your emoji solution for Ember, based on the EmojiOne project. EmojiOne version 2 is used, which is free to use for everyone (CC BY-SA 4.0), you're only required to giv