Python绘图之二维图与三维图详解
各位工程师累了吗? 推荐一篇可以让你技术能力达到出神入化的网站"持久男"
1.二维绘图
a. 一维数据集
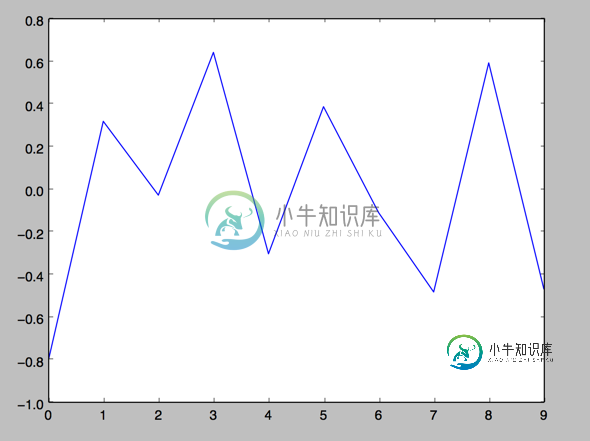
用 Numpy ndarray 作为数据传入 ply
1.
import numpy as np
import matplotlib as mpl
import matplotlib.pyplot as plt

np.random.seed(1000)
y = np.random.standard_normal(10)
print "y = %s"% y
x = range(len(y))
print "x=%s"% x
plt.plot(y)
plt.show()

2.操纵坐标轴和增加网格及标签的函数
import numpy as np
import matplotlib as mpl
import matplotlib.pyplot as plt

np.random.seed(1000)
y = np.random.standard_normal(10)
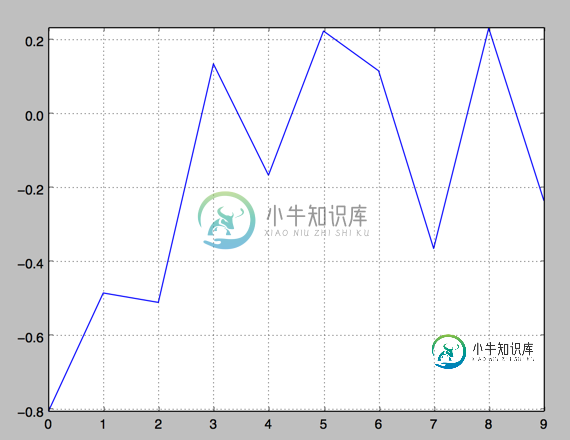
plt.plot(y.cumsum())
plt.grid(True) ##增加格点
plt.axis('tight') # 坐标轴适应数据量 axis 设置坐标轴
plt.show()
3.plt.xlim 和 plt.ylim 设置每个坐标轴的最小值和最大值
#!/etc/bin/python
#coding=utf-8
import numpy as np
import matplotlib as mpl
import matplotlib.pyplot as plt

np.random.seed(1000)
y = np.random.standard_normal(20)
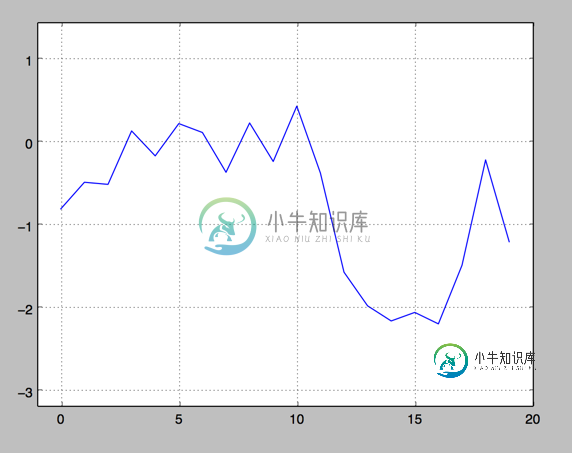
plt.plot(y.cumsum())
plt.grid(True) ##增加格点
plt.xlim(-1,20)
plt.ylim(np.min(y.cumsum())- 1, np.max(y.cumsum()) + 1)

plt.show()
4. 添加标题和标签 plt.title, plt.xlabe, plt.ylabel 离散点, 线
#!/etc/bin/python
#coding=utf-8
import numpy as np
import matplotlib as mpl
import matplotlib.pyplot as plt

np.random.seed(1000)
y = np.random.standard_normal(20)

plt.figure(figsize=(7,4)) #画布大小
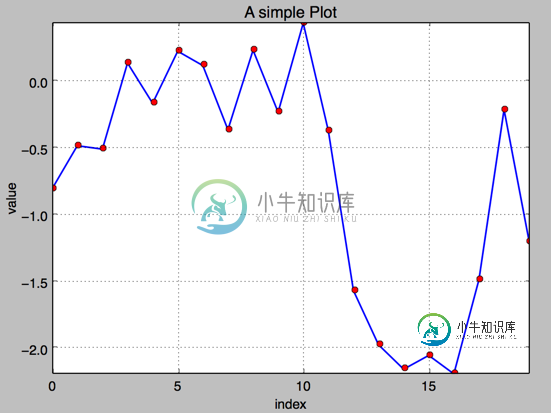
plt.plot(y.cumsum(),'b',lw = 1.5) # 蓝色的线
plt.plot(y.cumsum(),'ro') #离散的点
plt.grid(True)
plt.axis('tight')
plt.xlabel('index')
plt.ylabel('value')
plt.title('A simple Plot')
plt.show()
b. 二维数据集
np.random.seed(2000)
y = np.random.standard_normal((10, 2)).cumsum(axis=0)  #10行2列  在这个数组上调用cumsum 计算赝本数据在0轴(即第一维)上的总和
print y

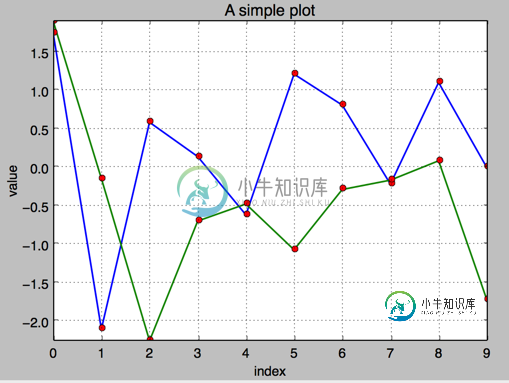
1.两个数据集绘图
#!/etc/bin/python
#coding=utf-8
import numpy as np
import matplotlib as mpl
import matplotlib.pyplot as plt

np.random.seed(2000)
y = np.random.standard_normal((10, 2))
plt.figure(figsize=(7,5))
plt.plot(y, lw = 1.5)
plt.plot(y, 'ro')
plt.grid(True)
plt.axis('tight')
plt.xlabel('index')
plt.ylabel('value')
plt.title('A simple plot')
plt.show()
2.添加图例 plt.legend(loc = 0)
#!/etc/bin/python
#coding=utf-8
import numpy as np
import matplotlib as mpl
import matplotlib.pyplot as plt

np.random.seed(2000)
y = np.random.standard_normal((10, 2))
plt.figure(figsize=(7,5))
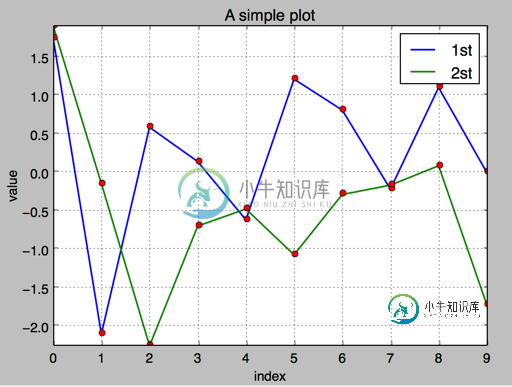
plt.plot(y[:,0], lw = 1.5,label = '1st')
plt.plot(y[:,1], lw = 1.5, label = '2st')
plt.plot(y, 'ro')
plt.grid(True)
plt.legend(loc = 0) #图例位置自动
plt.axis('tight')
plt.xlabel('index')
plt.ylabel('value')
plt.title('A simple plot')
plt.show()
3.使用2个 Y轴(左右)fig, ax1 = plt.subplots() ax2 = ax1.twinx()
#!/etc/bin/python
#coding=utf-8
import numpy as np
import matplotlib as mpl
import matplotlib.pyplot as plt

np.random.seed(2000)
y = np.random.standard_normal((10, 2))

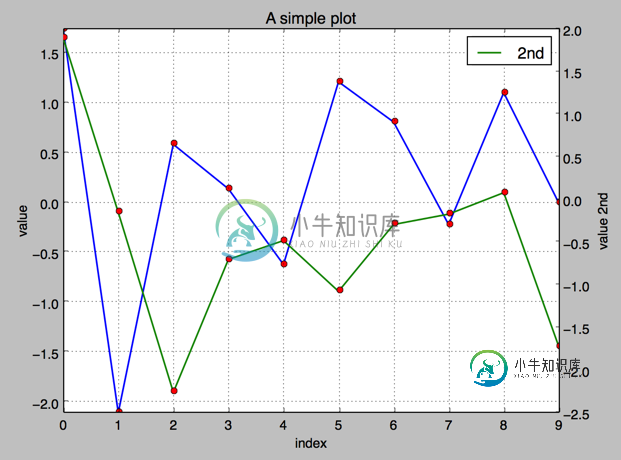
fig, ax1 = plt.subplots() # 关键代码1 plt first data set using first (left) axis

plt.plot(y[:,0], lw = 1.5,label = '1st')

plt.plot(y[:,0], 'ro')
plt.grid(True)
plt.legend(loc = 0) #图例位置自动
plt.axis('tight')
plt.xlabel('index')
plt.ylabel('value')
plt.title('A simple plot')

ax2 = ax1.twinx() #关键代码2 plt second data set using second(right) axis
plt.plot(y[:,1],'g', lw = 1.5, label = '2nd')
plt.plot(y[:,1], 'ro')
plt.legend(loc = 0)
plt.ylabel('value 2nd')
plt.show()
4.使用两个子图(上下,左右)plt.subplot(211)
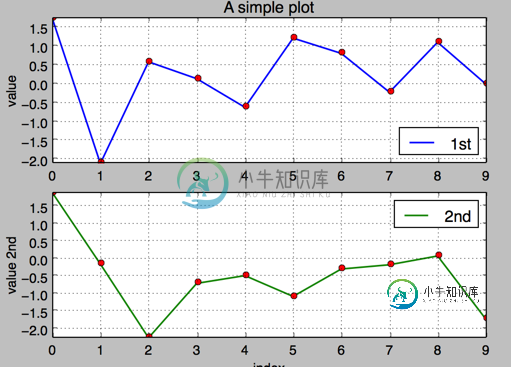
通过使用 plt.subplots 函数,可以直接访问底层绘图对象,例如可以用它生成和第一个子图共享 x 轴的第二个子图.
#!/etc/bin/python
#coding=utf-8
import numpy as np
import matplotlib as mpl
import matplotlib.pyplot as plt

np.random.seed(2000)
y = np.random.standard_normal((10, 2))

plt.figure(figsize=(7,5))
plt.subplot(211) #两行一列,第一个图
plt.plot(y[:,0], lw = 1.5,label = '1st')
plt.plot(y[:,0], 'ro')
plt.grid(True)
plt.legend(loc = 0) #图例位置自动
plt.axis('tight')
plt.ylabel('value')
plt.title('A simple plot')


plt.subplot(212) #两行一列.第二个图
plt.plot(y[:,1],'g', lw = 1.5, label = '2nd')
plt.plot(y[:,1], 'ro')
plt.grid(True)
plt.legend(loc = 0)
plt.xlabel('index')
plt.ylabel('value 2nd')
plt.axis('tight')
plt.show()
5.左右子图
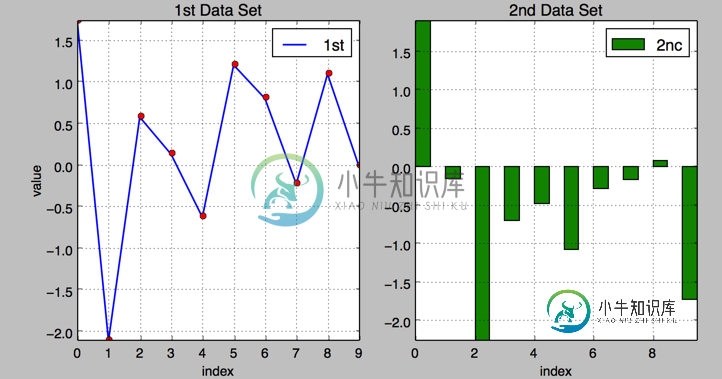
有时候,选择两个不同的图标类型来可视化数据可能是必要的或者是理想的.利用子图方法:
#!/etc/bin/python
#coding=utf-8
import numpy as np
import matplotlib as mpl
import matplotlib.pyplot as plt

np.random.seed(2000)
y = np.random.standard_normal((10, 2))

plt.figure(figsize=(10,5))
plt.subplot(121) #两行一列,第一个图
plt.plot(y[:,0], lw = 1.5,label = '1st')
plt.plot(y[:,0], 'ro')
plt.grid(True)
plt.legend(loc = 0) #图例位置自动
plt.axis('tight')
plt.xlabel('index')
plt.ylabel('value')
plt.title('1st Data Set')

plt.subplot(122)
plt.bar(np.arange(len(y)), y[:,1],width=0.5, color='g',label = '2nc')
plt.grid(True)
plt.legend(loc=0)
plt.axis('tight')
plt.xlabel('index')
plt.title('2nd Data Set')
plt.show()
c.其他绘图样式,散点图,直方图等
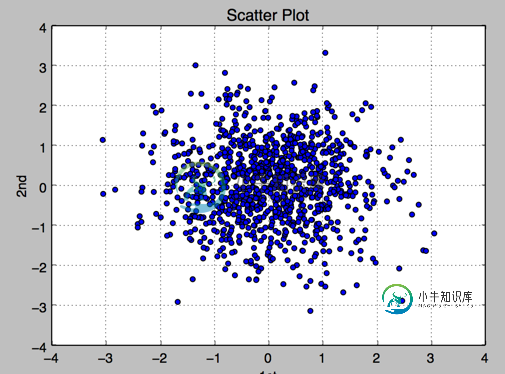
1.散点图
#!/etc/bin/python
#coding=utf-8
import numpy as np
import matplotlib as mpl
import matplotlib.pyplot as plt

np.random.seed(2000)
y = np.random.standard_normal((1000, 2))
plt.figure(figsize=(7,5))
plt.scatter(y[:,0],y[:,1],marker='o')
plt.grid(True)
plt.xlabel('1st')
plt.ylabel('2nd')
plt.title('Scatter Plot')
plt.show()
2.直方图 plt.hist
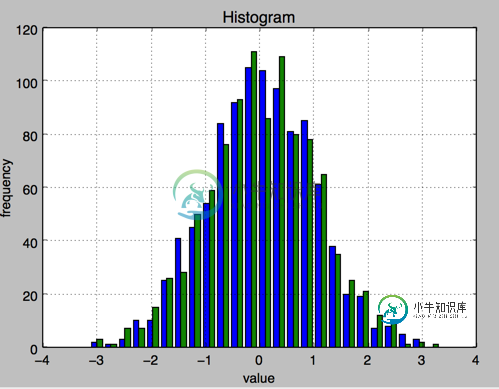
#!/etc/bin/python
#coding=utf-8
import numpy as np
import matplotlib as mpl
import matplotlib.pyplot as plt

np.random.seed(2000)
y = np.random.standard_normal((1000, 2))
plt.figure(figsize=(7,5))
plt.hist(y,label=['1st','2nd'],bins=25)
plt.grid(True)
plt.xlabel('value')
plt.ylabel('frequency')
plt.title('Histogram')
plt.show()
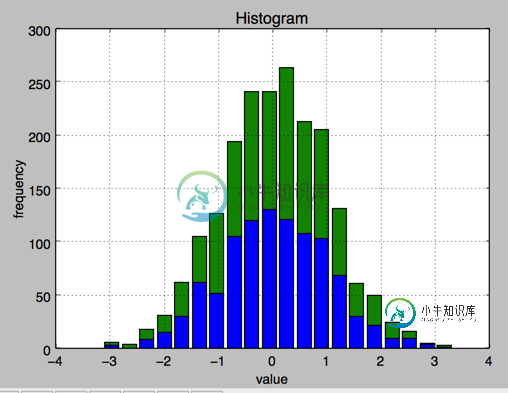
3.直方图 同一个图中堆叠
#!/etc/bin/python
#coding=utf-8
import numpy as np
import matplotlib as mpl
import matplotlib.pyplot as plt

np.random.seed(2000)
y = np.random.standard_normal((1000, 2))
plt.figure(figsize=(7,5))
plt.hist(y,label=['1st','2nd'],color=['b','g'],stacked=True,bins=20)
plt.grid(True)
plt.xlabel('value')
plt.ylabel('frequency')
plt.title('Histogram')
plt.show()
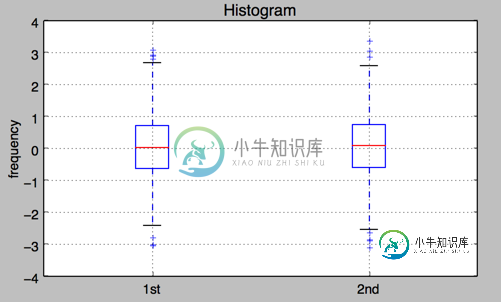
4.箱型图 boxplot
#!/etc/bin/python
#coding=utf-8
import numpy as np
import matplotlib as mpl
import matplotlib.pyplot as plt

np.random.seed(2000)
y = np.random.standard_normal((1000, 2))
fig, ax = plt.subplots(figsize=(7,4))
plt.boxplot(y)

plt.grid(True)
plt.setp(ax,xticklabels=['1st' , '2nd'])
plt.xlabel('value')
plt.ylabel('frequency')
plt.title('Histogram')
plt.show()
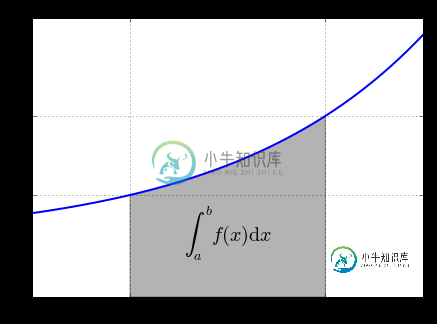
5.绘制函数
from matplotlib.patches import Polygon
import numpy as np
import matplotlib.pyplot as plt

#1. 定义积分函数
def func(x):
  return 0.5 * np.exp(x)+1

#2.定义积分区间
a,b = 0.5, 1.5
x = np.linspace(0, 2 )
y = func(x)
#3.绘制函数图形
fig, ax = plt.subplots(figsize=(7,5))
plt.plot(x,y, 'b',linewidth=2)
plt.ylim(ymin=0)
#4.核心, 我们使用Polygon函数生成阴影部分,表示积分面积:
Ix = np.linspace(a,b)
Iy = func(Ix)
verts = [(a,0)] + list(zip(Ix, Iy))+[(b,0)]
poly = Polygon(verts,facecolor='0.7',edgecolor = '0.5')
ax.add_patch(poly)
#5.用plt.text和plt.figtext在图表上添加数学公式和一些坐标轴标签。
plt.text(0.5 *(a+b),1,r"$\int_a^b f(x)\mathrm{d}x$", horizontalalignment ='center',fontsize=20)
plt.figtext(0.9, 0.075,'$x$')
plt.figtext(0.075, 0.9, '$f(x)$')
#6. 分别设置x,y刻度标签的位置。
ax.set_xticks((a,b))
ax.set_xticklabels(('$a$','$b$'))
ax.set_yticks([func(a),func(b)])
ax.set_yticklabels(('$f(a)$','$f(b)$'))
plt.grid(True)
2.金融学图表 matplotlib.finance
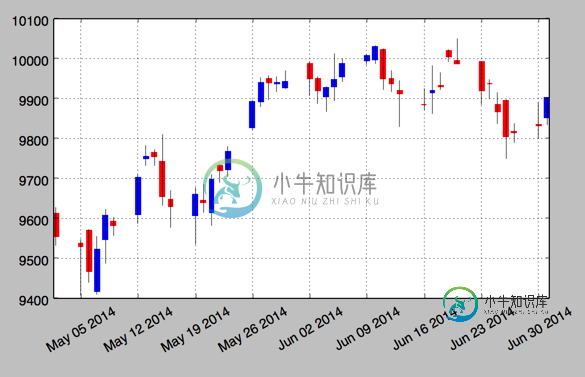
1.烛柱图 candlestick
#!/etc/bin/python
#coding=utf-8
import matplotlib.pyplot as plt
import matplotlib.finance as mpf
start = (2014, 5,1)
end = (2014, 7,1)
quotes = mpf.quotes_historical_yahoo('^GDAXI',start,end)
# print quotes[:2]

fig, ax = plt.subplots(figsize=(8,5))
fig.subplots_adjust(bottom = 0.2)
mpf.candlestick(ax, quotes, width=0.6, colorup='b',colordown='r')
plt.grid(True)
ax.xaxis_date() #x轴上的日期
ax.autoscale_view()
plt.setp(plt.gca().get_xticklabels(),rotation=30) #日期倾斜
plt.show()
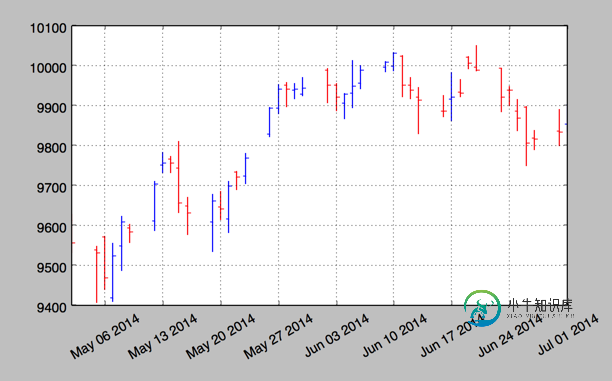
2. plot_day_summary
该函数提供了一个相当类似的图标类型,使用方法和 candlestick 函数相同,使用类似的参数. 这里开盘价和收盘价不是由彩色矩形表示,而是由两条短水平线表示.
#!/etc/bin/python
#coding=utf-8
import matplotlib.pyplot as plt
import matplotlib.finance as mpf
start = (2014, 5,1)
end = (2014, 7,1)
quotes = mpf.quotes_historical_yahoo('^GDAXI',start,end)
# print quotes[:2]

fig, ax = plt.subplots(figsize=(8,5))
fig.subplots_adjust(bottom = 0.2)
mpf.plot_day_summary(ax, quotes, colorup='b',colordown='r')
plt.grid(True)
ax.xaxis_date() #x轴上的日期
ax.autoscale_view()
plt.setp(plt.gca().get_xticklabels(),rotation=30) #日期倾斜
plt.show()
3.股价数据和成交量
#!/etc/bin/python
#coding=utf-8
import matplotlib.pyplot as plt
import numpy as np
import matplotlib.finance as mpf
start = (2014, 5,1)
end = (2014, 7,1)
quotes = mpf.quotes_historical_yahoo('^GDAXI',start,end)
# print quotes[:2]

quotes = np.array(quotes)
fig, (ax1, ax2) = plt.subplots(2, sharex=True, figsize=(8,6))
mpf.candlestick(ax1, quotes, width=0.6,colorup='b',colordown='r')
ax1.set_title('Yahoo Inc.')
ax1.set_ylabel('index level')
ax1.grid(True)
ax1.xaxis_date()
plt.bar(quotes[:,0] - 0.25, quotes[:, 5], width=0.5)

ax2.set_ylabel('volume')
ax2.grid(True)
ax2.autoscale_view()
plt.setp(plt.gca().get_xticklabels(),rotation=30)
plt.show()

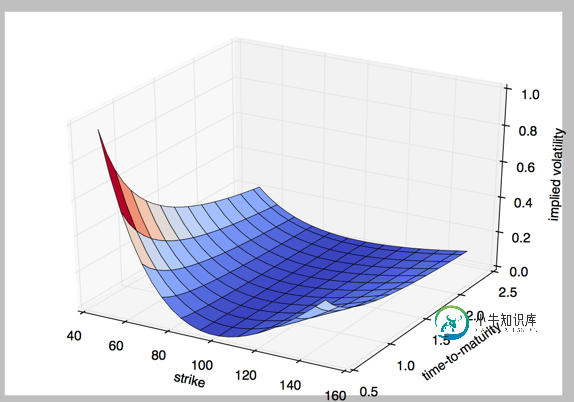
3.3D 绘图
#!/etc/bin/python
#coding=utf-8
import numpy as np
import matplotlib.pyplot as plt

stike = np.linspace(50, 150, 24)
ttm = np.linspace(0.5, 2.5, 24)
stike, ttm = np.meshgrid(stike, ttm)
print stike[:2]

iv = (stike - 100) ** 2 / (100 * stike) /ttm
from mpl_toolkits.mplot3d import Axes3D
fig = plt.figure(figsize=(9,6))
ax = fig.gca(projection='3d')
surf = ax.plot_surface(stike, ttm, iv, rstride=2, cstride=2, cmap=plt.cm.coolwarm, linewidth=0.5, antialiased=True)
ax.set_xlabel('strike')
ax.set_ylabel('time-to-maturity')
ax.set_zlabel('implied volatility')

plt.show()
到此这篇关于Python绘图之二维图与三维图详解的文章就介绍到这了,更多相关Python绘图内容请搜索小牛知识库以前的文章或继续浏览下面的相关文章希望大家以后多多支持小牛知识库!
-
本文向大家介绍python matplotlib绘制三维图的示例,包括了python matplotlib绘制三维图的示例的使用技巧和注意事项,需要的朋友参考一下 作者:catmelo 本文版权归作者所有 链接:https://www.cnblogs.com/catmelo/p/4162101.html 本文参考官方文档:http://matplotlib.org/mpl_toolkits/mpl
-
本文向大家介绍Python三维绘图之Matplotlib库的使用方法,包括了Python三维绘图之Matplotlib库的使用方法的使用技巧和注意事项,需要的朋友参考一下 前言 在遇到三维数据时,三维图像能给我们对数据带来更加深入地理解。python的matplotlib库就包含了丰富的三维绘图工具。 1.创建三维坐标轴对象Axes3D 创建Axes3D主要有两种方式,一种是利用关键字projec
-
我有一个三维阵列。列的标题是“身高”、“体重”和“年龄”。如何使用或任何其他可用功能绘制三维直方图? 我从这段代码开始,但后来我陷入了如何绘制三维直方图的困境。谢谢你宝贵的时间
-
我正在探索mpld3库,不知道如何创建三维散点图。使用Matplotlib,我将执行以下操作: 类似地,我尝试使用mpld3(在Jupyter笔记本中):导入matplotlib。mpl_工具包中的pyplot作为plt。mplot3d导入轴3D导入mpld3 我得到了错误 有什么想法吗? 这是完整的错误日志:
-
本文向大家介绍matplotlib 三维图表绘制方法简介,包括了matplotlib 三维图表绘制方法简介的使用技巧和注意事项,需要的朋友参考一下 1. python三维图表绘制方法简介 python三维图表的绘制算是二维图表的一个进阶版本,本质上和二维图表的绘制并无差别,唯一的区别在于使用的库略有差异。 相较于二维图表使用的pyplot库,三维图表的绘制使用的是Axes3D库。 库引入语句为:
-
目标 在本章中,我们将学习查找和绘制二维直方图。这将在未来的章节中有所帮助。 介绍 在第一篇文章中,我们计算和绘制了一维直方图。它是一维的,因为我们只考虑一个特征,即像素的灰度强度值。但是在二维直方图中,您会考虑两个特征。通常在查找颜色直方图时,这两个特征是每个像素的色调和饱和度值。 有一个 python 示例(samples/python/color_histogram.py)已经用于展示如何查

