d3.js - d3 报错Error: <path> attribute d: Expected number?
问题描述
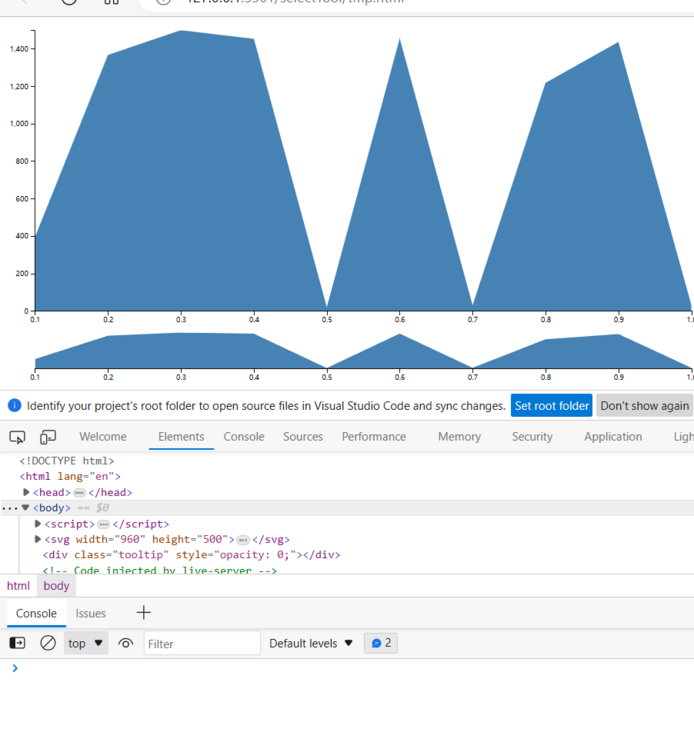
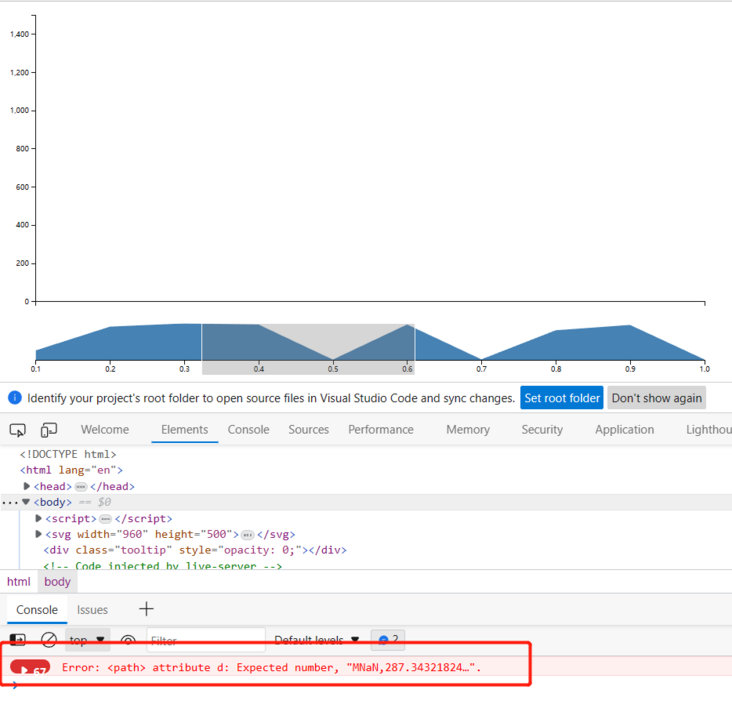
在使用d3 v7版本时用 brush过程中 报错Error: <path> attribute d: Expected number
这个问题在 d3 v3版时不存在的,可正常使用
两边的逻辑是一样的
代码如下:
<!DOCTYPE html>
<html lang="en">
<head>
    <meta charset="UTF-8">
    <meta http-equiv="X-UA-Compatible" content="IE=edge">
    <meta name="viewport" content="width=device-width, initial-scale=1.0">
    <script src="../dll/d3.min.js"></script>
    <link rel="stylesheet" href="./select.css">
    <title>Document</title>
</head>
<body>
<script>
    var margin = {top: 10, right: 10, bottom: 100, left: 40},
    margin2 = {top: 430, right: 10, bottom: 20, left: 40},
    width = 960 - margin.left - margin.right,
    height = 500 - margin.top - margin.bottom,
    height2 = 500 - margin2.top - margin2.bottom;

var x = d3.scaleLinear().range([0,width]),
    x2 = d3.scaleLinear().range([0,width]),
    y = d3.scaleLinear().range([height, 0]),
    y2 = d3.scaleLinear().range([height2, 0]);

var xAxis = d3.axisBottom(x),
    xAxis2 = d3.axisBottom(x2),
    yAxis = d3.axisLeft(y);

var brush = d3.brushX(x2)
      .extent([[margin.left, 0.5], [width - margin.right, height - margin.bottom + 0.5]])
      .on("brush", brushed);


var area = d3.area()
    //.interpolate("monotone")
    .x(function(d) { return x(d.date); })
    .y0(height)
    .y1(function(d) { return y(d.price); })
    ;

var area2 = d3.area()
    //.interpolate("monotone")
    .x(function(d) { return x2(d.date); })
    .y0(height2)
    .y1(function(d) { return y2(d.price); });

var svg = d3.select("body").append("svg")
    .attr("width", width + margin.left + margin.right)
    .attr("height", height + margin.top + margin.bottom);

var div = d3.select("body").append("div")
    .attr("class", "tooltip")
    .style("opacity", 0);

svg.append("defs").append("clipPath")
    .attr("id", "clip")
  .append("rect")
    .attr("width", width)
    .attr("height", height);


var focus = svg.append("g")
    .attr("class", "focus")
    .attr("transform", "translate(" + margin.left + "," + margin.top + ")");

var context = svg.append("g")
    .attr("class", "context")
    .attr("transform", "translate(" + margin2.left + "," + margin2.top + ")");

var data =  [{ "date":"0.1",  "price":394.46},
  { "date":"0.2",  "price":1366.42},
  { "date":"0.3",  "price":1498.58},
  { "date":"0.4",  "price":1452.43},
  { "date":"0.5",  "price":20.6},
  { "date":"0.6",  "price":1454.6},
  { "date":"0.7",  "price":30.83},
  { "date":"0.8",  "price":1217.68},
  { "date":"0.9",  "price":1436.51},
  { "date":"1.0",  "price":29.4}
  ];


  x.domain(d3.extent(data.map(function(d) { return d.date; })));
  y.domain([0, d3.max(data.map(function(d) { return d.price; }))]);
  x2.domain(x.domain());
  y2.domain(y.domain());

  focus.append("path")
      .datum(data)
      .attr("class", "area")
      .attr("d", area);

  focus.append("g")
      .attr("class", "x axis")
      .attr("transform", "translate(0," + height + ")")
      .call(xAxis);

  focus.append("g")
      .attr("class", "y axis")
      .call(yAxis);

  context.append("path")
      .datum(data)
      .attr("class", "area")
      .attr("d", area2);

  context.append("g")
      .attr("class", "x axis")
      .attr("transform", "translate(0," + height2 + ")")
      .call(xAxis2);

  context.append("g")
      .attr("class", "x brush")
      .call(brush)
    .selectAll("rect")
      .attr("y", -6)
      .attr("height", height2 + 7);

function brushed() {
  x.domain(brush.extent());
  focus.select(".area").attr("d", area);
  focus.select(".x.axis").call(xAxis);
}

function type(d) {
  d.date = d.date;
  d.price = +d.price;
  return d;
}

</script>
</body>
</html>
调试结果如下:

若知道原因请解答一下,谢谢。
共有1个答案
改一下 brushed 函数:
function brushed(event) {
  if (event.selection) {
    x.domain([event.selection[0], event.selection[1]]);
    focus.select(".area").attr("d", area);
    focus.select(".x.axis").call(xAxis);
  }
}-
在 2D canvas 中绘图时可以使用如下代码: function drawCircle(context, radius) { context.moveTo(radius, 0); context.arc(0, 0, radius, 0, 2 * Math.PI); } d3-path 模块可以将上述代码同时渲染到 SVG 中。通过将 CanvasPathMethods seriali
-
在 2D canvas 中绘图时可以使用如下代码: function drawCircle(context, radius) { context.moveTo(radius, 0); context.arc(0, 0, radius, 0, 2 * Math.PI); } d3-path 模块可以将上述代码同时渲染到 SVG 中。通过将 CanvasPathMethods seriali
-
D3(Data-Driven Documents 或 D3.js)是一个 JavaScript 库,用于使用 Web 标准将数据可视化。D3 帮助你使用SVG、 Canvas 和 HTML 将数据变为现实。D3 将强大的可视化和交互技术与数据驱动的DOM操作方法相结合,让你拥有现代浏览器的全部功能,并可以自由地为您的数据设计合适的可视化界面。
-
D3.js是一个JavaScript库,用于在浏览器中创建交互式可视化。 D3库允许我们在数据集的上下文中操纵网页的元素。 这些元素可以是HTML,SVG或Canvas元素,可以根据数据集的内容进行引入,删除或编辑。 它是一个用于操作DOM对象的库。 D3.js可以成为数据探索的宝贵帮助。 它使您可以控制数据的表示,并允许您添加数据交互性。 与其他库相比,D3.js是最重要的框架之一。 这是因为;
-
本文向大家介绍d3.js 使用D3 js创建SVG元素,包括了d3.js 使用D3 js创建SVG元素的使用技巧和注意事项,需要的朋友参考一下 示例 尽管D3并非专门用于处理SVG元素,但它已广泛用于创建和处理基于SVG的复杂数据可视化。D3提供了许多强大的方法,可帮助轻松创建各种几何SVG结构。 建议首先了解SVG规范的基本概念,然后使用大量的D3 js示例创建可视化效果。 D3 JS范例 SV
-
本文向大家介绍d3.js 元素,包括了d3.js 元素的使用技巧和注意事项,需要的朋友参考一下 示例 <rect> 代表矩形,除了笔触和填充之类的美学属性外,矩形还应通过位置和大小来定义。 至于位置,由x和y属性确定。该位置相对于矩形的父级。而且,如果您未指定x或y属性,则相对于父元素,默认值为0。 在指定位置或矩形的“起点”之后,接下来就是指定尺寸,如果您想在画布上实际绘制某东西,这是必不可少的

