
如何添加标签和标题matplotlib.pyplot.matshow情节

提前感谢您的帮助!(代码如下所示)
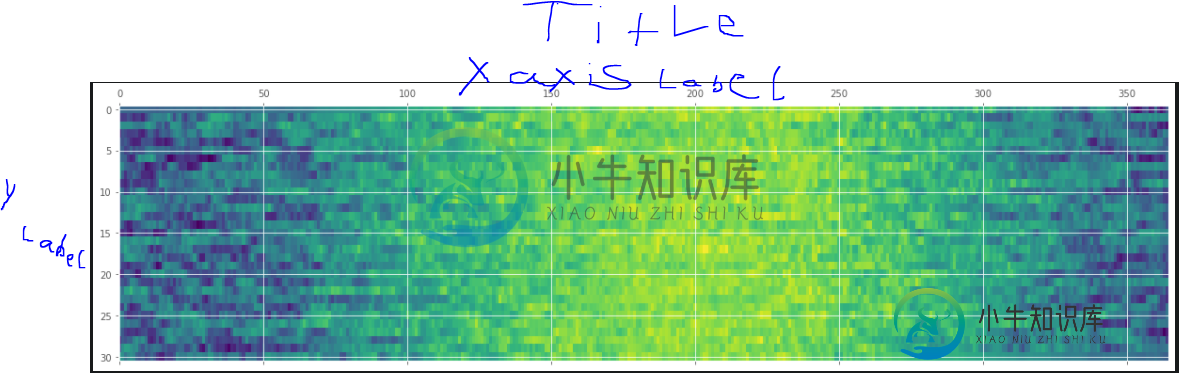
我正在绘制一个时间序列热图,我正在努力为x轴、y轴添加标签,并指定一个标题。我曾尝试使用xlabel='Days in a year',但出现以下语法错误:
AttributeError: 'AxesImage' object has no property 'xlabel'
当代码中没有xlabel='Hello'时,我没有得到这个错误。如何正确添加这些标签?应该是这样的:
import pandas as pd
import numpy as np
import matplotlib.pyplot as plt

# links to Minot data if you want to pull from the web
url1 = 'https://raw.githubusercontent.com/the-datadudes/deepSoilTemperature/master/minotDailyAirTemp.csv'

# load the data into a DataFrame, not a Series
# parse the dates, and set them as the index
# replace minotDailyAirTemp.csv with url if pulling from the web
df1 = pd.read_csv(url1, parse_dates=['Date'], index_col=['Date'])

# groupby year and aggregate Temp into a list
dfg1 = df1.groupby(df1.index.year).agg({'Temp': list})

# create a wide format dataframe with all the temp data expanded
df1_wide = pd.DataFrame(dfg1.Temp.tolist(), index=dfg1.index)


# adding the data between 1990/01/01 -/04/23 and delete the 29th of Feb
rng = pd.date_range(start='1990-01-01', end='1990-04-23', freq='D')
df = pd.DataFrame(index= rng)
df.index = pd.to_datetime(df.index)
df['Temp'] = np.NaN
frames = [df, df1]
result = pd.concat(frames)
result = result[~((result.index.month == 2) & (result.index.day == 29))]

dfg1 = result.groupby(result.index.year).agg({'Temp': list})
df1_wide = pd.DataFrame(dfg1['Temp'].tolist(), index=dfg1.index)

# Setting all leftover empty fields to the average of that time in order to fill in the gaps
df1_wide = df1_wide.apply(lambda x: x.fillna(x.mean()),axis=0)

# ploting the data

fig, (ax1) = plt.subplots(ncols=1, figsize=(20, 5))
ax1.matshow(df1_wide, interpolation=None, aspect='auto');
    ---------------------------------------------------------------------------
    AttributeError                            Traceback (most recent call last)
    <ipython-input-289-fd46af2ae9bf> in <module>
         36
         37 fig, (ax1) = plt.subplots(ncols=1, figsize=(20, 5))
    ---> 38 ax1.matshow(df1_wide, interpolation=None, aspect='auto', xlabel = 'Hello');
     39

    ~\anaconda3\lib\site-packages\matplotlib\axes\_axes.py in matshow(self, Z, **kwargs)
       7789               'aspect': 'equal',          # (already the imshow default)
       7790               **kwargs}
    -> 7791         im = self.imshow(Z, **kw)
       7792         self.title.set_y(1.05)
       7793         self.xaxis.tick_top()

    ~\anaconda3\lib\site-packages\matplotlib\__init__.py in inner(ax, data, *args, **kwargs)
       1563     def inner(ax, *args, data=None, **kwargs):
       1564         if data is None:
    -> 1565             return func(ax, *map(sanitize_sequence, args), **kwargs)
       1566
       1567         bound = new_sig.bind(ax, *args, **kwargs)

    ~\anaconda3\lib\site-packages\matplotlib\cbook\deprecation.py in wrapper(*args, **kwargs)
        356                 f"%(removal)s.  If any parameter follows {name!r}, they "
        357                 f"should be pass as keyword, not positionally.")
    --> 358         return func(*args, **kwargs)
        359
        360     return wrapper

    ~\anaconda3\lib\site-packages\matplotlib\axes\_axes.py in imshow(self, X, cmap, norm, aspect, interpolation, alpha, vmin, vmax, origin, extent, shape, filternorm, filterrad, imlim, resample, url, **kwargs)
       5620             aspect = rcParams['image.aspect']
       5621         self.set_aspect(aspect)
    -> 5622         im = mimage.AxesImage(self, cmap, norm, interpolation, origin, extent,
       5623                               filternorm=filternorm, filterrad=filterrad,
       5624                               resample=resample, **kwargs)

    ~\anaconda3\lib\site-packages\matplotlib\image.py in __init__(self, ax, cmap, norm, interpolation, origin, extent, filternorm, filterrad, resample, **kwargs)
        888         self._extent = extent
        889
    --> 890         super().__init__(
        891             ax,
        892             cmap=cmap,

    ~\anaconda3\lib\site-packages\matplotlib\image.py in __init__(self, ax, cmap,
norm, interpolation, origin, filternorm, filterrad, resample, **kwargs)
        259         self._imcache = None
        260
    --> 261         self.update(kwargs)
        262
        263     def __getstate__(self):

    ~\anaconda3\lib\site-packages\matplotlib\artist.py in update(self, props)
       1004
       1005         with cbook._setattr_cm(self, eventson=False):
    -> 1006             ret = [_update_property(self, k, v) for k, v in
    props.items()]
       1007
       1008         if len(ret):

    ~\anaconda3\lib\site-packages\matplotlib\artist.py in <listcomp>(.0)
       1004
       1005         with cbook._setattr_cm(self, eventson=False):
    -> 1006             ret = [_update_property(self, k, v) for k, v in
    props.items()]
       1007
       1008         if len(ret):

    ~\anaconda3\lib\site-packages\matplotlib\artist.py in _update_property(self, k, v)
        999                 func = getattr(self, 'set_' + k, None)
       1000                 if not callable(func):
    -> 1001                     raise AttributeError('{!r} object has no property
    {!r}'
       1002                                          .format(type(self).__name__, k))
       1003                 return func(v)

    AttributeError: 'AxesImage' object has no property 'xlabel'
共有1个答案

- 使用
。设置标题和。使用和轴进行打印时设置标签 xlabel、ylabel和title是熊猫的绘图函数内的唯一参数。数据帧。绘图,而不是为matplotlib绘图。pyplot。matshow
fig, (ax1) = plt.subplots(ncols=1, figsize=(10, 5))
ax1.matshow(df1_wide, interpolation=None, aspect='auto')

# add the title and label
ax1.set_title('Blah')
ax1.set_ylabel('Blah2')

# alternatively use just
ax1.set(title='Blah', ylabel='Blah2')
-
人们可以使用熊猫轻松地从数据框中创建子情节: 现在如何将x和y标签添加到生成的绘图中?这里是一个单一的情节解释。因此,如果我想向特定子批次添加标签,我可以: 这就产生了: 如何添加标签,使它们居中,而不仅仅是指一行/列?
-
类似 (https://visactor.io/vchart/demo/line-chart/basic-line)这样的折线图, 我希望给图表上方添加标题描述,该如何配置?
-
标签通常用于帮助记录图表设计进程。例如,解释一组表对象。若要创建一个新的标签,点击工具栏的 “标签”按钮,并点击画布的任意位置。 在画布中标签对象的弹出式菜单选项包括: 选项 描述 编辑 更改标签的内容。 剪切 从图表移除标签并放它在剪贴板。 复制 从图表复制标签到剪贴板。 粘贴 将剪贴板的内容贴到图表。 选择全部标签 在图表中选择全部标签。 删除 从图表中删除标签。 调整适合大小 自动调整标签的
-
标签通常用于帮助记录图表设计进程。例如,解释一组表对象。若要创建一个新的标签,点击工具栏的 “标签”按钮,并点击画布的任意位置。 在画布中标签对象的弹出式菜单选项包括: 选项 描述 编辑 更改标签的内容。 剪切 从图表移除标签并放它在剪贴板。 复制 从图表复制标签到剪贴板。 粘贴 将剪贴板的内容贴到图表。 选择全部标签 在图表中选择全部标签。 删除 从图表中删除标签。 调整适合大小 自动调整标签的
-
标签通常用于帮助记录图表设计进程。例如,解释一组表对象。若要创建一个新的标签,点击工具栏的 按钮,并点击画布的任意位置。 在画布中标签对象的弹出式菜单选项包括: 选项 描述 编辑 更改标签的内容。 剪切 从图表移除标签并放它在剪贴板。 复制 从图表复制标签到剪贴板。 粘贴 将剪贴板的内容贴到图表。 选择全部标签 在图表中选择全部标签。 删除 从图表中删除标签。 调整适合大小 自动调整标签的大小以适
-
标签通常用于帮助记录图表设计进程。例如,解释一组表对象。若要创建一个新的标签,点击工具栏的 按钮,并点击画布的任意位置。 在画布中标签对象的弹出式菜单选项包括: 选项 描述 编辑 更改标签的内容。 剪切 从图表移除标签并放它在剪贴板。 复制 从图表复制标签到剪贴板。 粘贴 将剪贴板的内容贴到图表。 选择全部标签 在图表中选择全部标签。 删除 从图表中删除标签。 调整适合大小 自动调整标签的大小以适