
将EPSG:3857(“web mercator”)中bokeh瓷砖供应商的投影更改为EPSG:4326中我的来源

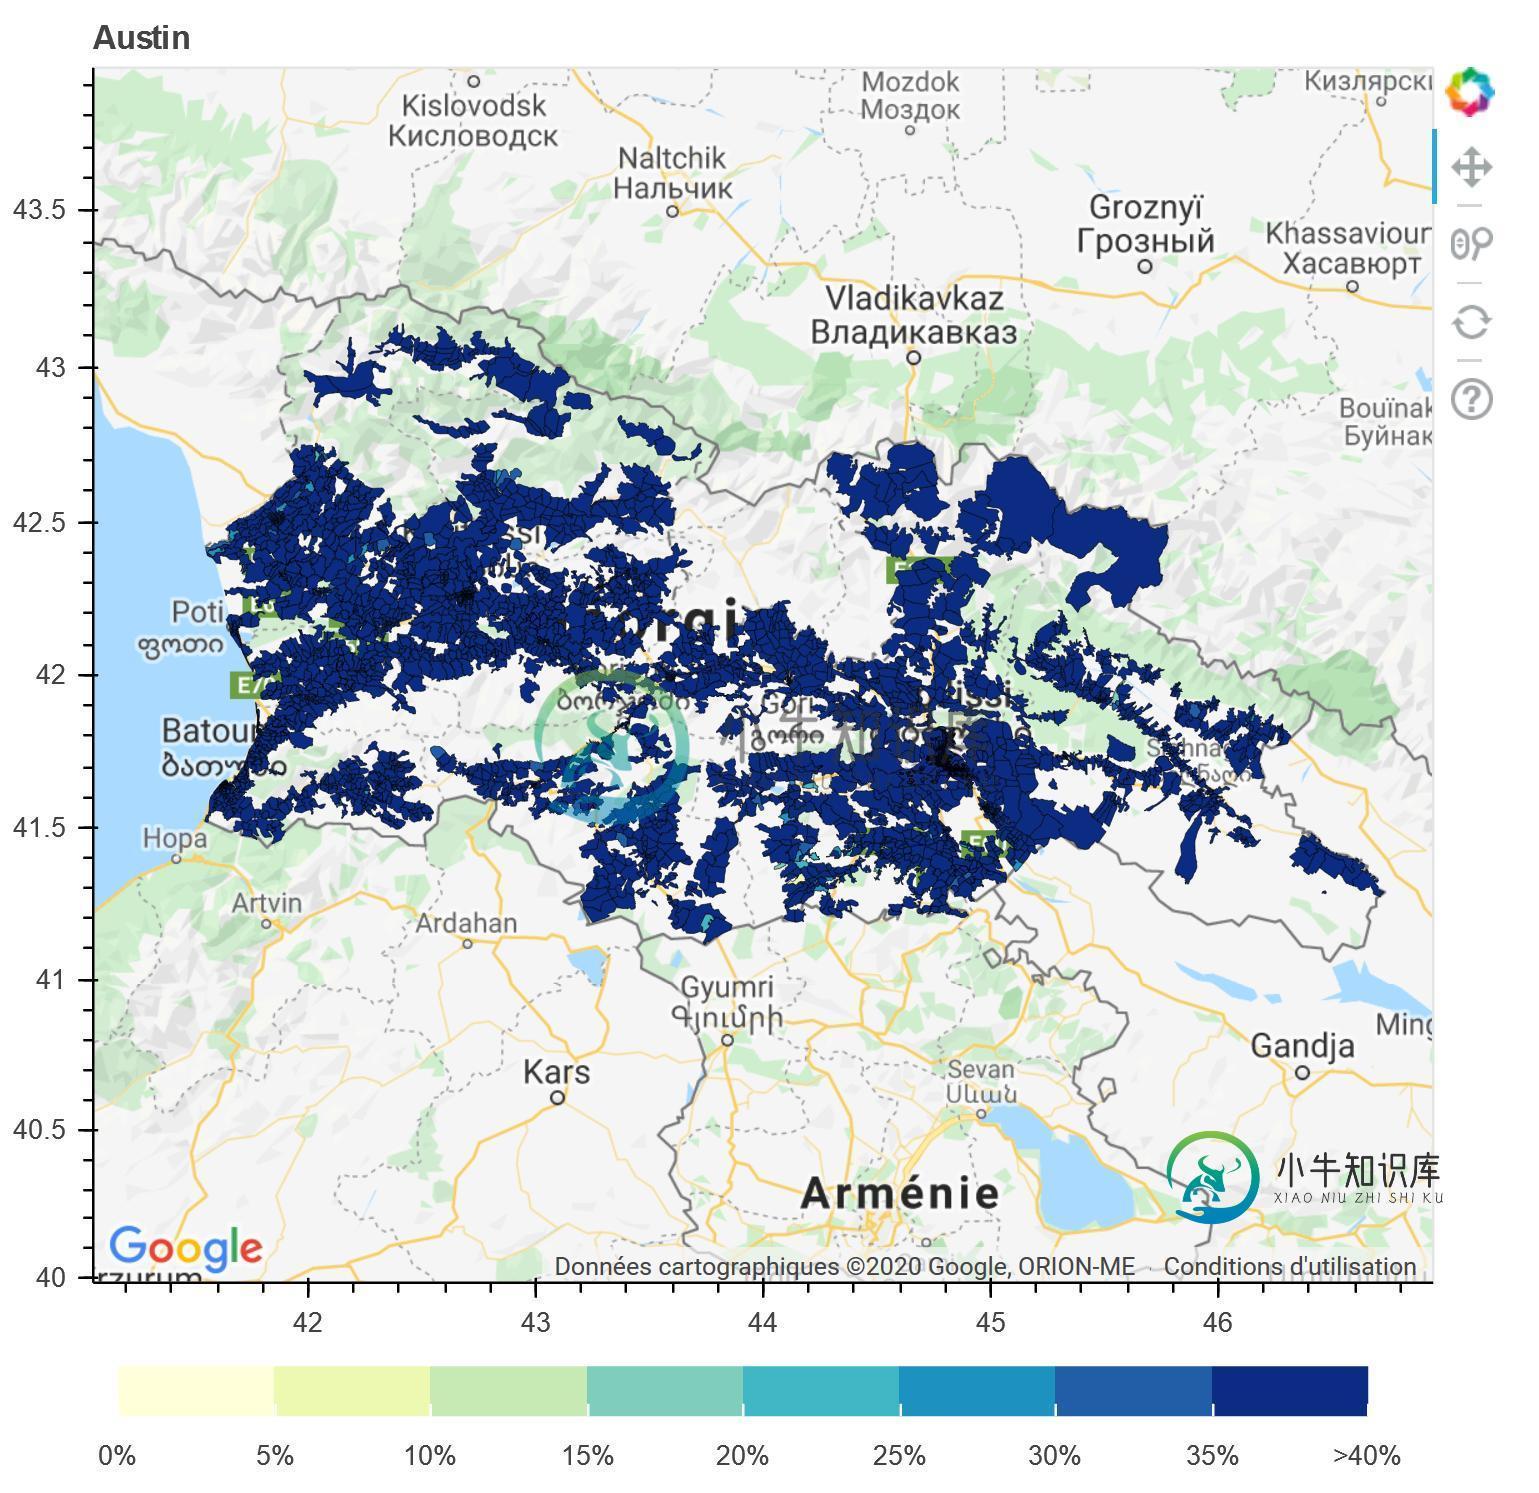
我能够使用Bokeh从一个geopandas数据帧在谷歌地图上使用gmap()函数绘制字形。
from bokeh.io import output_notebook, show, output_file
from bokeh.plotting import figure
from bokeh.models import GeoJSONDataSource, LinearColorMapper, ColorBar
from bokeh.palettes import brewer#Input GeoJSON source that contains features for plotting.

import json

from bokeh.models import ColumnDataSource, GMapOptions
from bokeh.plotting import gmap

def make_dataset(df, candidate):
    #df_copy = df.copy()
    df_copy = get_df(candidate)
    merged_json = json.loads(df_copy.to_json())#Convert to String like object.
    json_data = json.dumps(merged_json)
    geosource = GeoJSONDataSource(geojson = json_data)
    return geosource

def make_plot(candidate):
    src = make_dataset(df,candidate)
    #Input GeoJSON source that contains features for plotting.
    p = figure(title = 'Results of candidate X', plot_height = 600 , plot_width = 950, toolbar_location = None)

    map_options = GMapOptions(lat=42, lng=44, map_type="roadmap", zoom=7)

    p = gmap("my-key", map_options, title="Austin")
    p.xgrid.grid_line_color = None
    p.ygrid.grid_line_color = None#Add patch renderer to figure.
    p.patches('xs','ys', source = src,fill_color = {'field' :'results', 'transform' : color_mapper},
              line_color = 'black', line_width = 0.25, fill_alpha = 1)#Specify figure layout.
    p.add_layout(color_bar, 'below')#Display figure inline in Jupyter Notebook.
    output_notebook()#Display figure.
    return p
它给我:
然而,当我使用Carto作为提供商绘制时,如这里所解释的,轴上有一个错误:
    tile_provider = get_provider(Vendors.CARTODBPOSITRON)

    # range bounds supplied in web mercator coordinates
    p = figure(x_range=(-2000000, 6000000), y_range=(-1000000, 7000000))#, x_axis_type="mercator", y_axis_type="mercator")
    p.add_tile(tile_provider)
    p.xgrid.grid_line_color = None
    p.ygrid.grid_line_color = None#Add patch renderer to figure.
    p.patches('xs','ys', source = src,fill_color = {'field' :'results', 'transform' : color_mapper},
              line_color = 'black', line_width = 0.25, fill_alpha = 1)#Specify figure layout.
    p.add_layout(color_bar, 'below')#Display figure inline in Jupyter Notebook.
    output_notebook()#Display figure.
    return p
因此,它在地图上的位置是错误的,人们可以看到红色圆圈:
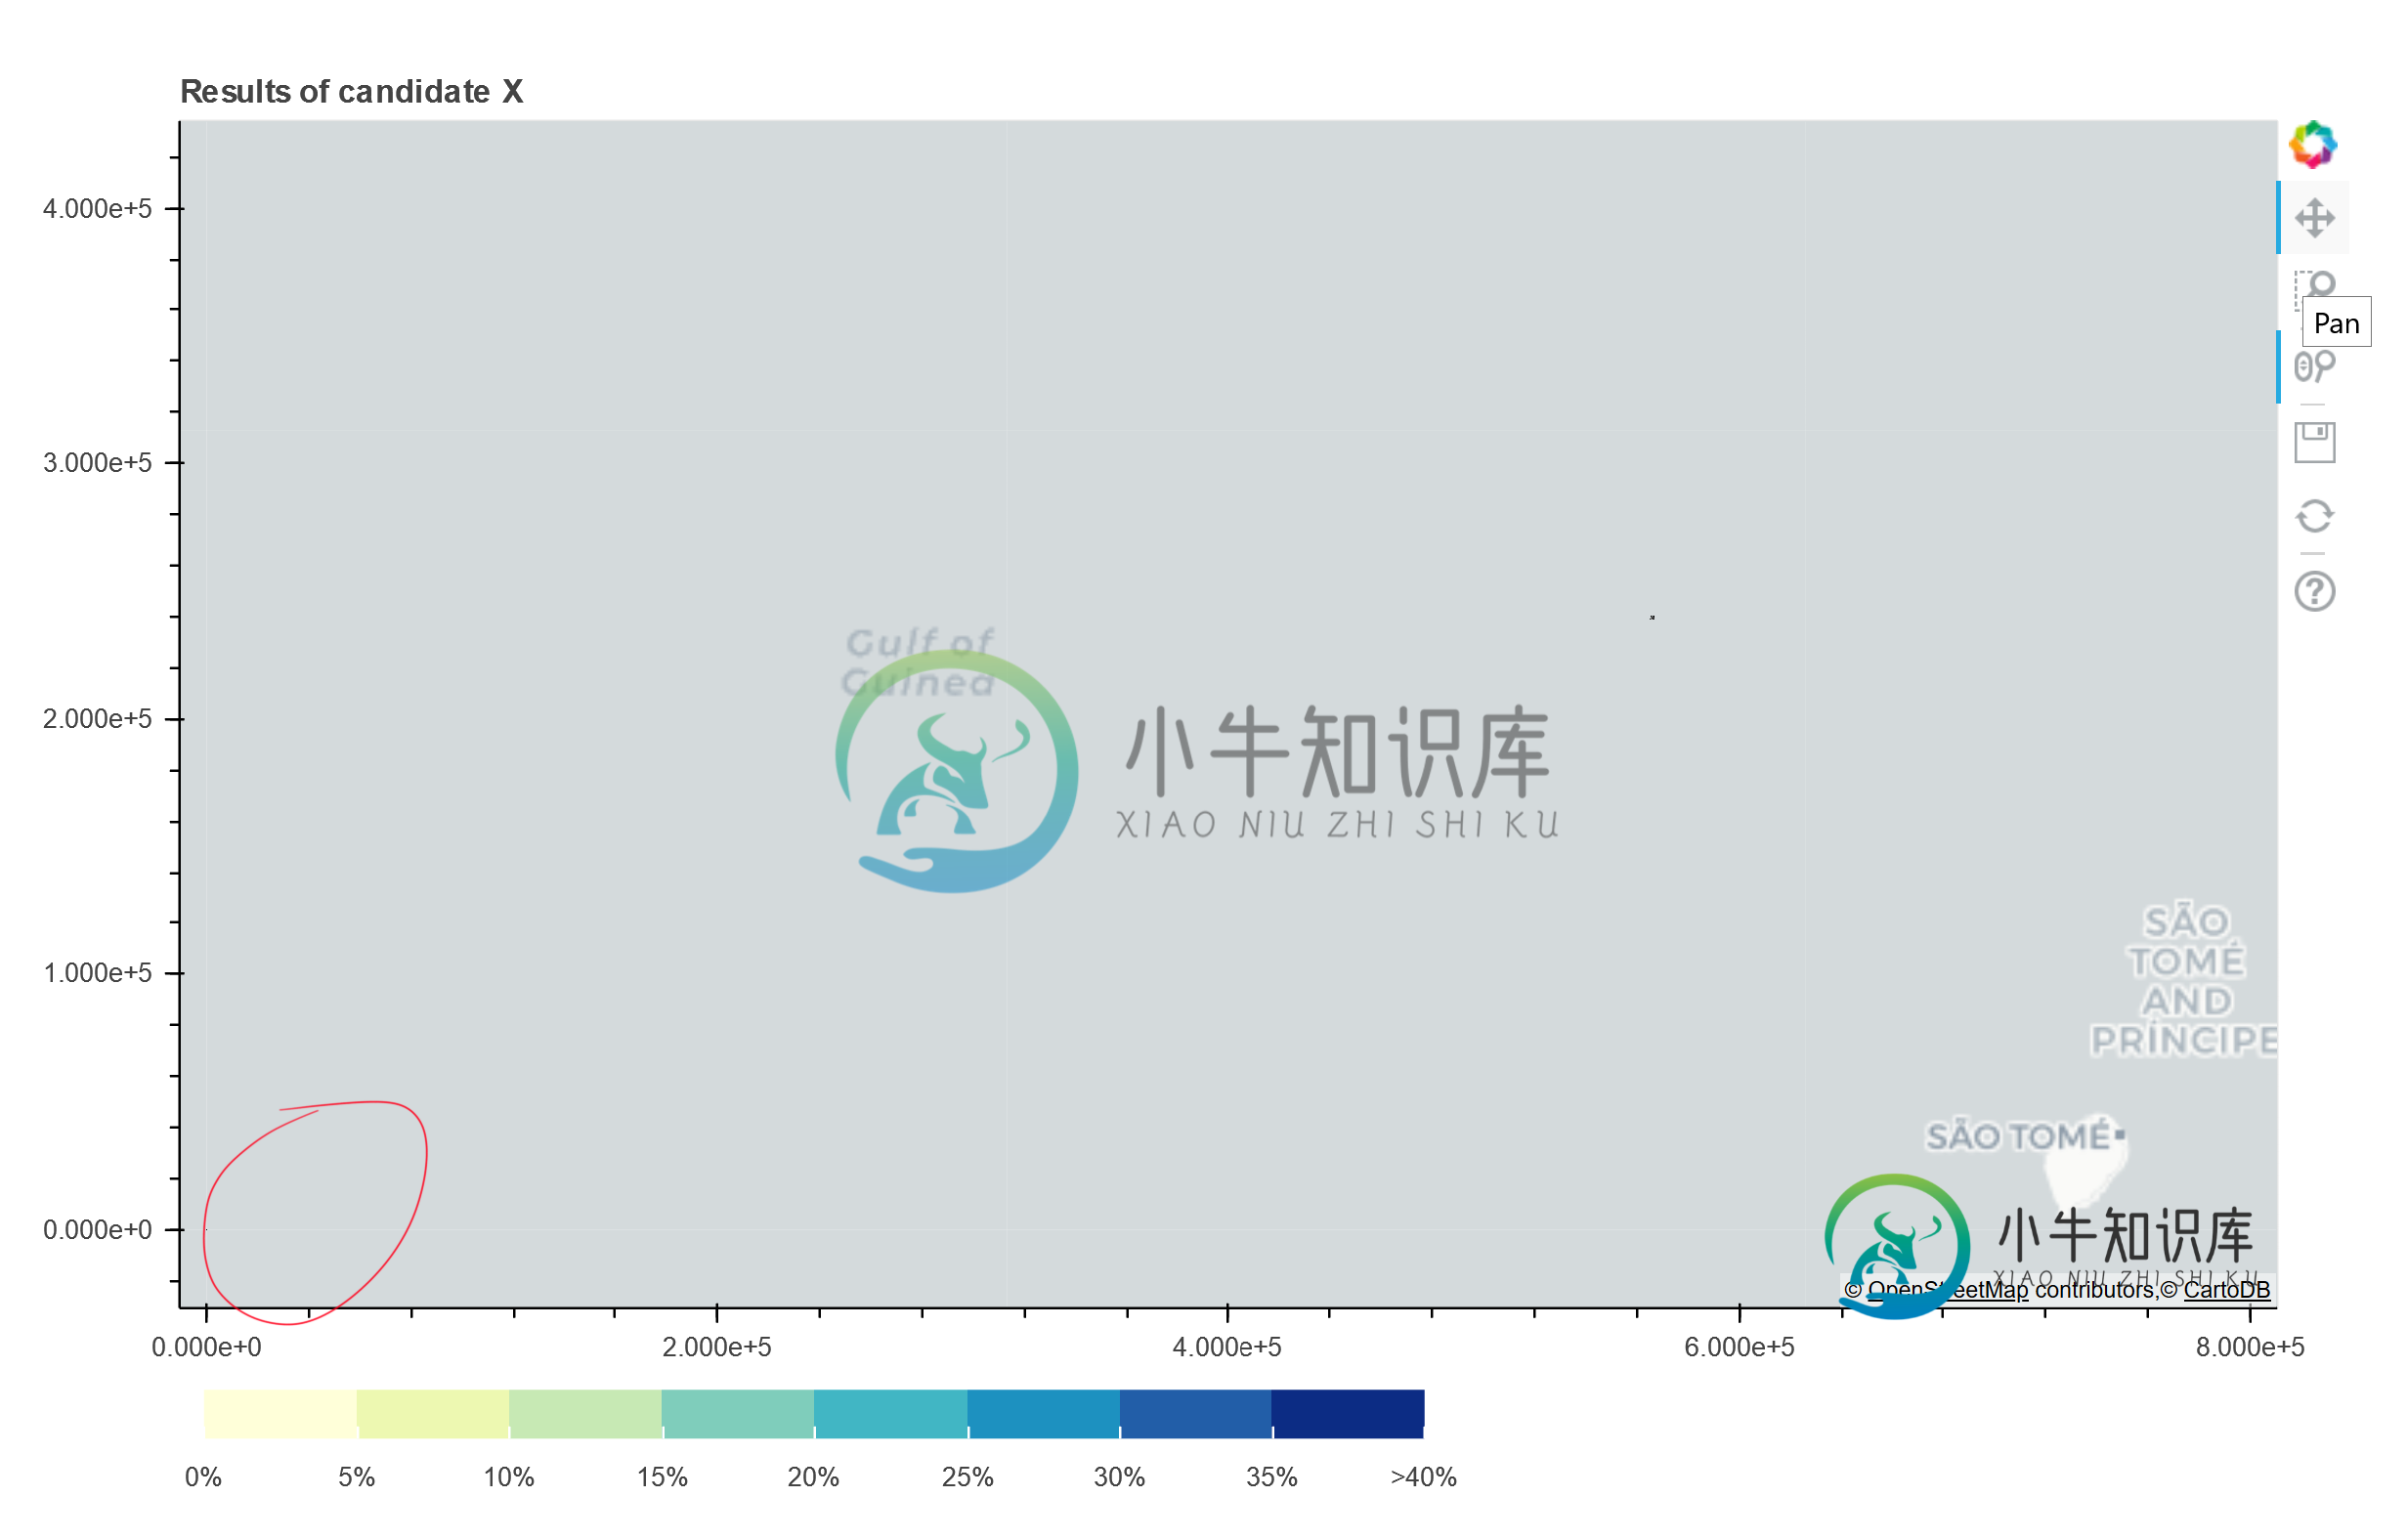
看起来地图在EPSG: 3857(“网络墨卡托”),而我的来源可能在EPSG: 4326。我怎样才能正确地绘制它?
这是我的数据的前几行:
    id  parent_id common_id common_name  has_children  shape_type_id  \
64  70140      69935         3        63-3         False              4
65  70141      69935         2        63-2         False              4
66  70142      69935         5        63-5         False              4
67  70143      69935         6        63-6         False              4
68  70144      69935         8        63-8         False              4

   shape_type_name    value color  title_location results  \
64        Precinct  No Data  None  Precinct: 63-3   65.16
65        Precinct  No Data  None  Precinct: 63-2   57.11
66        Precinct  No Data  None  Precinct: 63-5   54.33
67        Precinct  No Data  None  Precinct: 63-6   59.15
68        Precinct  No Data  None  Precinct: 63-8   61.86

                                             turnout  \
64  {'pct': 46.38, 'count': 686.0, 'eligible': 1479}
65   {'pct': 49.62, 'count': 394.0, 'eligible': 794}
66  {'pct': 58.26, 'count': 624.0, 'eligible': 1071}
67   {'pct': 57.54, 'count': 492.0, 'eligible': 855}
68   {'pct': 50.75, 'count': 506.0, 'eligible': 997}

                                             geometry
64  POLYGON ((42.18180 42.18530, 42.18135 42.18593...
65  POLYGON ((42.20938 42.20621, 42.21156 42.20706...
66  POLYGON ((42.08429 42.20468, 42.08489 42.20464...
67  POLYGON ((42.16270 42.16510, 42.16661 42.16577...
68  POLYGON ((42.16270 42.16510, 42.16315 42.16640...
共有1个答案

您必须将数据从EPSG:4326重新投影到EPSG:3857
下面是一个包含一些GeoJSON数据的解决方案:
# requirements
# !pip install pandas numpy bokeh geopandas

import pandas as pd
import numpy as np


def lon_to_web_mercator(lon):
    k = 6378137
    return lon * (k * np.pi / 180.0)


def lat_to_web_mercator(lat):
    k = 6378137
    return np.log(np.tan((90 + lat) * np.pi / 360.0)) * k


def wgs84_to_web_mercator(df, lon="lon", lat="lat"):
    """Converts decimal longitude/latitude to Web Mercator format"""
    k = 6378137
    df["x"] = df[lon] * (k * np.pi / 180.0)
    df["y"] = np.log(np.tan((90 + df[lat]) * np.pi / 360.0)) * k
    return df


BerlinWGS84 = [13.08835, 13.76116, 52.33826, 52.67551]

Berlin = x_range, y_range = ((lon_to_web_mercator(BerlinWGS84[0]), lon_to_web_mercator(BerlinWGS84[1])),
                             (lat_to_web_mercator(BerlinWGS84[2]), lat_to_web_mercator(BerlinWGS84[3])))


# plot it
from bokeh.plotting import figure, show, output_notebook
from bokeh.tile_providers import get_provider, Vendors
output_notebook()

tile_provider = get_provider(Vendors.CARTODBPOSITRON)


# range bounds sgupplied in web mercator coordinates
p = figure(x_range=x_range, y_range=y_range,
           x_axis_type="mercator", y_axis_type="mercator")
p.add_tile(tile_provider)

show(p)


# geopandas

import geopandas as gpd
import requests


def remoteGeoJSONToGDF(url, display=False):
    # source: https://medium.com/@maptastik/remote-geojson-to-geodataframe-19c3c1282a64
    """Import remote GeoJSON to a GeoDataFrame
    Keyword arguments:
    url -- URL to GeoJSON resource on web
    display -- Displays geometries upon loading (default: False)
    """
    r = requests.get(url)
    data = r.json()
    gdf = gpd.GeoDataFrame.from_features(data['features'])
    if display:
        gdf.plot()
    return gdf


url = 'https://gist.githubusercontent.com/sabman/96730f5949576e7793a3f79eb390f90c/raw/7ffcf34239175cafcc9a63382e6beacd0cab9fa9/BerlinFeatures.geojson'
gdf = remoteGeoJSONToGDF(url)

gdf.plot()

# make sure initial projection is defined
gdf.crs = {'init': 'epsg:4326'}
gdf_webmerc = gdf.copy()
# reproject
gdf_webmerc = gdf['geometry'].to_crs(epsg=3857)
gdf_webmerc.plot()

from bokeh.models import GeoJSONDataSource
geo_source = GeoJSONDataSource(geojson=gdf_webmerc.to_json())

# let's plot and look
p.circle(x='x', y='y', size=15, alpha=0.7, source=geo_source)
show(p)
-
我正在使用sharpmap将MSSQL中的边界(几何体)渲染为PNG图像。这一切都很好,除了国家在平面图像格式上看起来太“宽”。 据我所知,我需要创建到EPSG:3857投影的转换,但我不知道如何做。 这是我的密码 WKT可以在这里找到https://pastebin.com/PEbpAdxT 感谢您的帮助。 编辑2 我也尝试了以下转换,但这会呈现空白的png(没有红色的十字线)
-
Geoserver2.5中的WFS实现存在严重错误。 我将数据集加载到SQL Server和PostGIS中。该数据集由几个点组成,采用本机EPSG:3857。 已为SQL Server连接设置Geometry_Columns表,并且在Geoserver设置中一切正常。 但是,尝试通过OpenLayers访问WFS: wfs1.0。0 |获取|修复| SQL Server WFS 1.0.0|GE
-
我有一个Geopandas数据帧与epsg: 4326的CRS,我想转换为espg: 102001的CRC,它有一个项目4定义如下: 在我的 /usr/share/proj目录中,投影位于esri.extra文件中,而不是proj_def.dat文件中,从下面的屏幕截图中可以看到: 1)Grep命令搜索102001的结果和2) /usr/share/proj目录的ls的屏幕截图 根据Geopand
-
我试图使用Struts 2 我在 glassfish 服务器上上传时遇到以下错误: 部署过程中发生错误:加载应用程序时出现异常:java.lang.IllegalState异常:ContainerBase.add子级:开始:org.apache.catalina.生命周期异常:java.lang.NoClassDefFoundError: org/spingframewor /core/io/su
-
我有几个关于PostGIS中几何和地理的问题。 我目前正在使用PostGIS和PostgreSQL。 我的大部分空间数据来自韩国,基本上是经纬度。 为了进行测试,我创建了两个具有相同经纬度数据但数据类型不同的表,一个是使用SRID4326的地理表,另一个是使用SRID5186的几何表。 您可以在以下链接https://EPSG.io/5186上找到EPSG5186的更多详细信息 以下是我得到的一系
-
我使用的是Spring 3.0 tiles。我为所有页面创建了带有锚定标记的公共菜单,并为相同页面应用了css。我使用Jquery在单击菜单时动态更改菜单的css类。 选择菜单/链接时,将应用“selectedTab”css类,对于所有正常链接,将应用“tab”css类。我面临的问题是,每次请求/单击菜单时,都会应用style类,然后在响应后再次取消应用。也就是说,样式仍然应用于请求和响应之间。但