Matplotlib不同大小的子情节
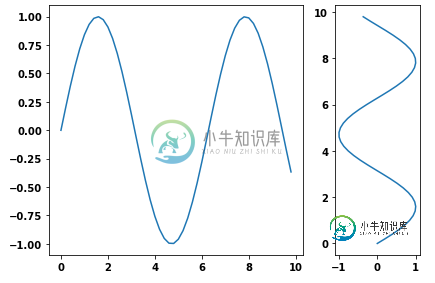
我需要在一个图形中添加两个子图。一个子图的宽度必须是第二个子图的三倍(相同高度)。我使用GridSpec和colspan参数实现了这一点,但我想使用figure实现这一点,这样我就可以保存到PDF。我可以使用构造函数中的figsize参数调整第一个图形,但是如何更改第二个绘图的大小?
共有3个答案
我使用pyplot的axes对象手动调整大小,而不使用GridSpec:
import matplotlib.pyplot as plt
import numpy as np
x = np.arange(0, 10, 0.2)
y = np.sin(x)

# definitions for the axes
left, width = 0.07, 0.65
bottom, height = 0.1, .8
bottom_h = left_h = left+width+0.02

rect_cones = [left, bottom, width, height]
rect_box = [left_h, bottom, 0.17, height]

fig = plt.figure()

cones = plt.axes(rect_cones)
box = plt.axes(rect_box)

cones.plot(x, y)

box.plot(y, x)

plt.show()
您可以使用gridspec和图:
import numpy as np
import matplotlib.pyplot as plt
from matplotlib import gridspec

# generate some data
x = np.arange(0, 10, 0.2)
y = np.sin(x)

# plot it
fig = plt.figure(figsize=(8, 6))
gs = gridspec.GridSpec(1, 2, width_ratios=[3, 1])
ax0 = plt.subplot(gs[0])
ax0.plot(x, y)
ax1 = plt.subplot(gs[1])
ax1.plot(y, x)

plt.tight_layout()
plt.savefig('grid_figure.pdf')
- 另一种方法是使用
subplot函数,并使用gridspec\u kw- matplotlib教程:使用GridSpec和其他函数自定义地物布局
matplotlib.gridspec.gridspec具有可用的gridspect\u kw选项
import numpy as np
import matplotlib.pyplot as plt

# generate some data
x = np.arange(0, 10, 0.2)
y = np.sin(x)

# plot it
f, (a0, a1) = plt.subplots(1, 2, gridspec_kw={'width_ratios': [3, 1]})
a0.plot(x, y)
a1.plot(y, x)

f.tight_layout()
f.savefig('grid_figure.pdf')
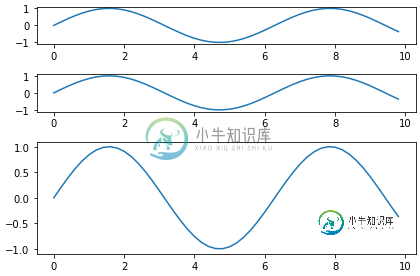
- 因为这个问题是规范的,所以这里有一个垂直子图的例子
# plot it
f, (a0, a1, a2) = plt.subplots(3, 1, gridspec_kw={'height_ratios': [1, 1, 3]})

a0.plot(x, y)
a1.plot(x, y)
a2.plot(x, y)

f.tight_layout()
-
第二个数字,我想补充: 我尝试: #在这里我添加了第四个数字,但我不知道我该怎么做...
-
以下是我遇到问题的tableViewController的代码:
-
我有下一个树状图代码 而这个输出 如何更改每个子情节的大小?
-
本文向大家介绍Python+matplotlib绘制不同大小和颜色散点图实例,包括了Python+matplotlib绘制不同大小和颜色散点图实例的使用技巧和注意事项,需要的朋友参考一下 具有不同标记颜色和大小的散点图演示。 演示结果: 实现代码: 总结 以上就是本文关于Python+matplotlib绘制不同大小和颜色散点图实例的全部内容,希望对大家有所帮助。感兴趣的朋友可以继续参阅本站其他
-
我想问你一个关于matplotlib中的子批大小的问题。我需要创建一个固定大小的图形,由一行中的3个子地块组成。出于“编辑原因”,我需要确定图形的大小,但我也想确定子地块的大小和位置,而不影响图形大小(第三个子地块必须比前两个子地块窄)。 我尝试使用GridSpec,但没有成功。我还尝试使用“figsize”来固定图形大小,并为子地块使用add\u轴,但根据子地块的相对大小,图形和子地块的总体大小
-
问题内容: 我正在使用matplotlib制作直方图。 有什么方法可以手动设置垃圾箱的大小,而不是垃圾箱的数量吗? 问题答案: 实际上,这很简单:您可以提供一个带有bin边界的列表,而不是bin的数量。它们也可能分布不均: 如果只希望它们均匀分布,则可以使用range: 添加到原始答案 上一行仅适用于整数填充。正如macrocosme所指出的,对于浮点数,您可以使用:

