问题:

MPAndroid图表不显示任何标签,缺少什么?
慕容典

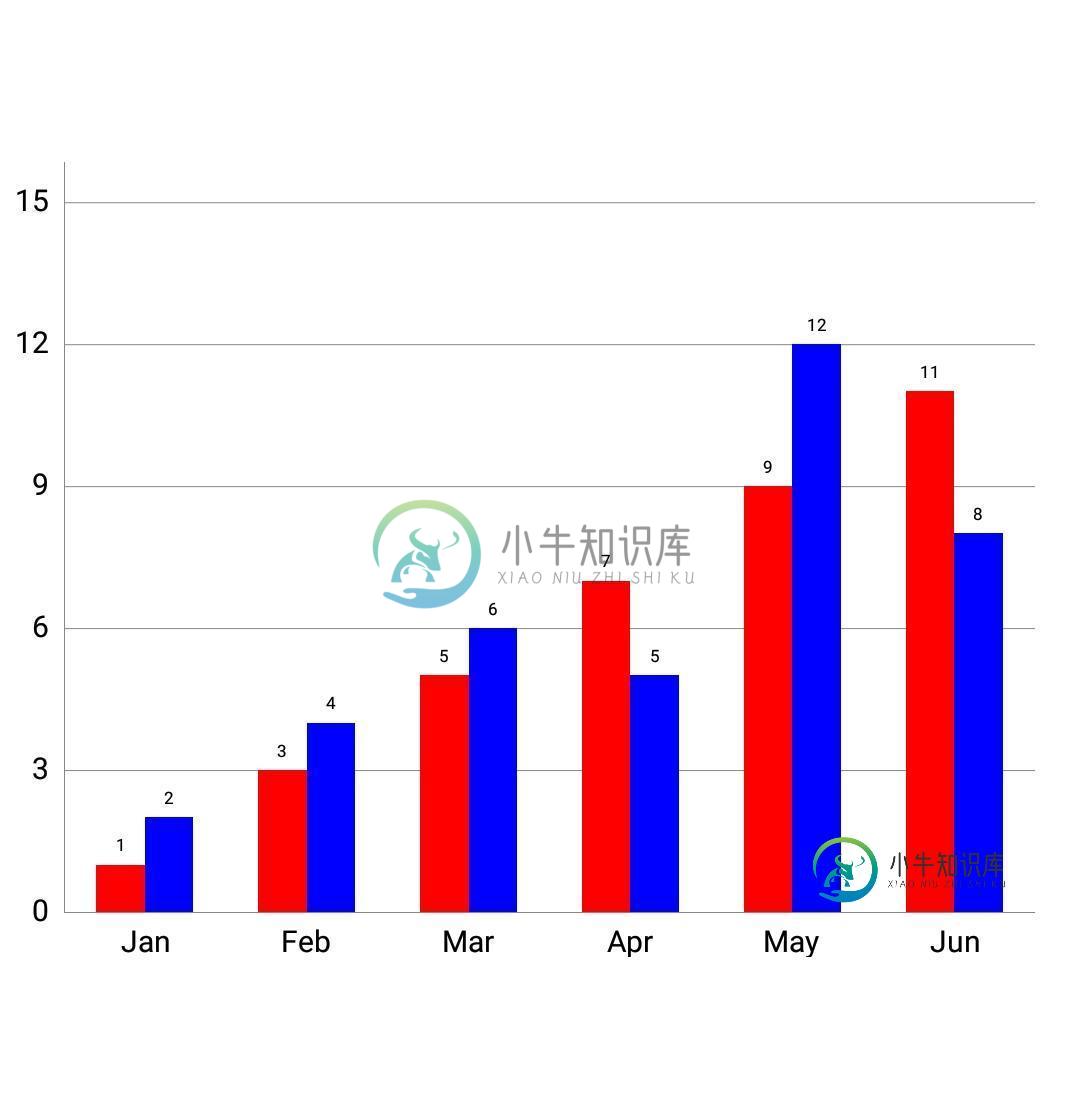
因此,我必须根据选择的过滤器显示目标标签,例如,如果选择了3个月过滤器,则需要显示3月,2月
这是我的代码,请纠正任何问题:
  fun showOrderChart(){
        try {
            orderChart.description.isEnabled=false
            orderChart.setMaxVisibleValueCount(60)
            // scaling can now only be done on x- and y-axis separately

            // scaling can now only be done on x- and y-axis separately
            orderChart.setPinchZoom(true)

            orderChart.setDrawBarShadow(false)
            orderChart.setDrawGridBackground(false)

          /*  val xAxis: XAxis = orderChart.xAxis
            xAxis.position = XAxisPosition.BOTTOM
            xAxis.setDrawGridLines(false)*/

            orderChart.axisLeft.setDrawGridLines(false)

            // add a nice and smooth animation

            // add a nice and smooth animation
            orderChart.animateY(1500)

            orderChart.legend.isEnabled = false


            val xVals = ArrayList<String>()
            xVals.add("Jan")
            xVals.add("Feb")
            xVals.add("Mar")
            xVals.add("Apr")
            xVals.add("May")
            xVals.add("Jun")
            val yVals1 = ArrayList<BarEntry>()
            val yVals2 = ArrayList<BarEntry>()
            yVals1.add(BarEntry(1f, 1.toFloat()))
            yVals2.add(BarEntry(1f, 2.toFloat()))

            yVals1.add(BarEntry(2f, 3.toFloat()))
            yVals2.add(BarEntry(2f, 4.toFloat()))

            yVals1.add(BarEntry(3f, 5.toFloat()))
            yVals2.add(BarEntry(3f, 6.toFloat()))

            yVals1.add(BarEntry(4f, 7.toFloat()))
            yVals2.add(BarEntry(4f, 5.toFloat()))

            yVals1.add(BarEntry(5f, 9.toFloat()))
            yVals2.add(BarEntry(5f, 12.toFloat()))

            yVals1.add(BarEntry(6f, 11.toFloat()))
            yVals2.add(BarEntry(6f, 8.toFloat()))

            val set1:BarDataSet
            val set2:BarDataSet
            set1 = BarDataSet(yVals1, "Target")
            set1.color = Color.RED
            set2 = BarDataSet(yVals2, "Actual")
            set2.color = Color.BLUE
            val data = BarData(set1, set2)
            data.setValueFormatter(LargeValueFormatter())
            orderChart.data = data
            orderChart.getBarData().setBarWidth(0.3f)
            orderChart.xAxis.setAxisMinimum(0f)
            orderChart.getXAxis().setAxisMaximum(0 + orderChart.getBarData().getGroupWidth(0.4f, 0f) * 6)
            orderChart.groupBars(0f, 0.4f, 0f)
            orderChart.getData().setHighlightEnabled(false)
            orderChart.invalidate()

            val l = orderChart.getLegend()
            l.setVerticalAlignment(Legend.LegendVerticalAlignment.TOP)
            l.setHorizontalAlignment(Legend.LegendHorizontalAlignment.RIGHT)
            l.setOrientation(Legend.LegendOrientation.VERTICAL)
            l.setDrawInside(true)
            l.setYOffset(20f)
            l.setXOffset(0f)
            l.setYEntrySpace(0f)
            l.setTextSize(8f)

            val xAxis = orderChart.getXAxis()
            xAxis.granularity = 1f
            xAxis.setGranularityEnabled(true)
            xAxis.setCenterAxisLabels(true)
            xAxis.setDrawGridLines(false)
            xAxis.setAxisMaximum(6f)
            xAxis.setPosition(XAxis.XAxisPosition.BOTTOM)
            xAxis.setValueFormatter(IndexAxisValueFormatter(xVals))
            orderChart.getAxisRight().setEnabled(false)
            val leftAxis = orderChart.getAxisLeft()
            leftAxis.setValueFormatter(LargeValueFormatter())
            leftAxis.setDrawGridLines(true)
            leftAxis.setSpaceTop(35f)
            leftAxis.setAxisMinimum(0f)


        }catch (e: Exception){
            e.printStackTrace()
        }
    }
共有1个答案
扈翰
您需要标签的代码。这样地。
YAxis yAxisRight = lineChart.getAxisRight(); //set right of Y
yAxisRight.setDrawLabels(true);
类似资料:
-
我正在尝试使用MPAndroid图表来显示2组数据。没有语法错误或崩溃,但没有显示任何数据。这是我的代码。 每次我运行时页面都会崩溃。日志显示,“一个或多个DataSet Entry数组比此ChartData对象的x值数组长。”我记录了我的x轴值并检查了,两个数组的大小都是一样的!
-
我正在尝试使用vue-chartjs和Chart.js(2.7.1)绘制线图。显示图形,但没有xAx和yAx标签。 这是我的选项对象: 我认为scales.xAxes.scaleLabel不起作用。
-
我正在使用MPAndroidChart在我的android项目中绘制折线图,我看到X轴上的标签没有正确对齐,如下图所示。 未对齐标签
-
我正在使用JSONArray来填充我的MPAndroid条形图。但是条与它们的标签不对齐。像这样有人可以帮助我做些什么来将条与它们相应的标签对齐吗?
-
我一直试图弄清楚,并阅读了许多帖子。但是我无法在MPAndroid的条形图中设置标签到x轴。目前它正在显示条的位置。
-
尝试让字符串标签呈现在我的条形图的 x 轴上。只是没有出现。下面是代码片段。一切都很好,除了标签没有显示。我已经尝试设置以下内容,但仍然一无所获。 ...

