
path创建一条曲线来连接两个点

我目前正在用js尝试SVG路径,我想用一条曲线连接两点。以下是我目前的进展:
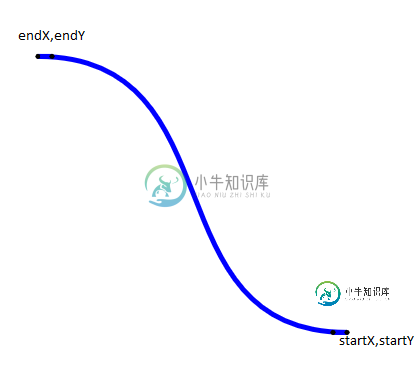
// draw a curvy line between point (startX,startY) and point (endX,endY)
function drawCurve(startX, startY, endX, endY) {

    // exemple of a path: M318,345 L330,345 C450,345 380,124 504,124 L519,124

    // M
    var AX = startX;
    var AY = startY;

    // L
    var BX = Math.abs(endX - startX) * 0.05 + startX;
    var BY = startY;

    // C
    var CX = (endX - startX) * 0.66 + startX;
    var CY = startY;
    var DX = (endX - startX) * 0.33 + startX;
    var DY = endY;
    var EX = - Math.abs(endX - startX) * 0.05 + endX;
    var EY = endY;

    // L
    var FX = endX;
    var FY = endY;

    // [DEBUGGING] add all the colored points for testing
    document.getElementById('pointA').setAttribute("cx", AX);
    document.getElementById('pointA').setAttribute("cy", AY);
    document.getElementById('pointB').setAttribute("cx", BX);
    document.getElementById('pointB').setAttribute("cy", BY);
    document.getElementById('pointC').setAttribute("cx", CX);
    document.getElementById('pointC').setAttribute("cy", CY);
    document.getElementById('pointD').setAttribute("cx", DX);
    document.getElementById('pointD').setAttribute("cy", DY);
    document.getElementById('pointE').setAttribute("cx", EX);
    document.getElementById('pointE').setAttribute("cy", EY);
    document.getElementById('pointF').setAttribute("cx", FX);
    document.getElementById('pointF').setAttribute("cy", FY);

    // setting up the path string
    var path = 'M' + AX + ',' + AY;
    path += ' L' + BX + ',' + BY;
    path +=  ' ' + 'C' + CX + ',' + CY;
    path += ' ' + DX + ',' + DY;
    path += ' ' + EX + ',' + EY;
    path += ' L' + FX + ',' + FY;

    // [DEBUGGING] display the path string
    console.log('path is '+path);

    // applying the new path to the element
    document.getElementById('myPath').setAttribute("d", path);

}

drawCurve(200,400, 519,124);
<svg height="1000" width="1000">
<path id="myPath" d="" stroke="blue" stroke-width="5" fill="none" />
<g stroke="black" stroke-width="3" fill="black">
<circle id="pointA" cx="318" cy="345" r="1" />
<circle id="pointB" cx="330" cy="345" r="1" />
</g>
<g stroke="red" stroke-width="3" fill="red">
<circle id="pointC" cx="450" cy="345" r="1" />
</g>
<g stroke="green" stroke-width="3" fill="green">
<circle id="pointD" cx="380" cy="124" r="1" />
</g>
<g stroke="black" stroke-width="3" fill="black">
<circle id="pointE" cx="504" cy="124" r="1" />
<circle id="pointF" cx="519" cy="124" r="1" />
</g>
</svg>CodePen版本在这里
看来我需要在路径中添加另一条曲线。
我还找到了这个工作的CodePen。
共有1个答案

不要使用starX和endX之间的有符号差来计算bezier控制点的位置,而是使用绝对值。
此外,要获得第二个控制点,从endX减去距离的三分之一,而不是向starX添加三分之二。
var CX = startX + Math.abs(endX - startX) * 0.33;
var DX = endX - Math.abs(endX - startX) * 0.33;
// draw a curvy line between point (startX,startY) and point (endX,endY)
function drawCurve(startX, startY, endX, endY) {

    // exemple of a path: M318,345 L330,345 C450,345 380,124 504,124 L519,124

    // M
    var AX = startX;
    console.log(AX);
    var AY = startY;

    // L
    var BX = Math.abs(endX - startX) * 0.05 + startX;
    var BY = startY;

    // C
    var CX = startX + Math.abs(endX - startX) * 0.33;
    var CY = startY;
    var DX = endX - Math.abs(endX - startX) * 0.33;
    var DY = endY;
    var EX = - Math.abs(endX - startX) * 0.05 + endX;
    var EY = endY;

    // L
    var FX = endX;
    var FY = endY;

    // [DEBUGGING] add all the colored points for testing
    document.getElementById('pointA').setAttribute("cx", AX);
    document.getElementById('pointA').setAttribute("cy", AY);
    document.getElementById('pointB').setAttribute("cx", BX);
    document.getElementById('pointB').setAttribute("cy", BY);
    document.getElementById('pointC').setAttribute("cx", CX);
    document.getElementById('pointC').setAttribute("cy", CY);
    document.getElementById('pointD').setAttribute("cx", DX);
    document.getElementById('pointD').setAttribute("cy", DY);
    document.getElementById('pointE').setAttribute("cx", EX);
    document.getElementById('pointE').setAttribute("cy", EY);
    document.getElementById('pointF').setAttribute("cx", FX);
    document.getElementById('pointF').setAttribute("cy", FY);

    // setting up the path string
    var path = 'M' + AX + ',' + AY;
    path += ' L' + BX + ',' + BY;
    path +=  ' ' + 'C' + CX + ',' + CY;
    path += ' ' + DX + ',' + DY;
    path += ' ' + EX + ',' + EY;
    path += ' L' + FX + ',' + FY;

    // [DEBUGGING] display the path string
    console.log(path);

    // applying the new path to the element
    document.getElementById('myPath').setAttribute("d", path);

}

//drawCurve(200,400, 519,124);
drawCurve(519,124, 200,400);
html prettyprint-override"><svg height="1000" width="1000">
<path id="myPath" d="" stroke="blue" stroke-width="5" fill="none" />
<g stroke="black" stroke-width="3" fill="black">
<circle id="pointA" cx="318" cy="345" r="1" />
<circle id="pointB" cx="330" cy="345" r="1" />
</g>
<g stroke="red" stroke-width="3" fill="red">
<circle id="pointC" cx="450" cy="345" r="1" />
</g>
<g stroke="green" stroke-width="3" fill="green">
<circle id="pointD" cx="380" cy="124" r="1" />
</g>
<g stroke="black" stroke-width="3" fill="black">
<circle id="pointE" cx="504" cy="124" r="1" />
<circle id="pointF" cx="519" cy="124" r="1" />
</g>
</svg>-
问题内容: 我如何(或可以使用哪些工具)在两个或多个元素之间画线以连接它们?HTML / CSS / JavaScript / SVG / Canvas的任何组合都可以。 如果您的答案支持以下任何一项,请提及: 可拖动元素 可拖动/可编辑的连接 避免元素重叠 该问题已更新,以巩固其众多变体。 问题答案: 是一个支持拖放的可用选项,从其众多演示包括Flowchart演示可以看出。 它提供免费的社区版
-
如何创建将不同列与不同表合并的视图?例如,我有三个表:用户、物品和礼物(在本例中,这是一个用户可以向另一个用户赠送礼物的系统) < code>users表包含有关用户的信息,< code>items表包含有关项目的信息,< code>gifts表显示哪个用户向哪个用户发送了什么礼物。 我想要的是创建如下视图:
-
我使用具有以下设置的Hikary连接池: 在getConnection()之后,hikari尝试获取到实例的2个连接,但只将一个连接放在连接池中。我怎样才能修好它?hikari版本是
-
我试图用s和每两个之间的连接线来进行类似网络的设计,但是当我用下面的JS函数使用和标记时,控制台显示了一个错误
-
通过组合曲线CurvePath可以把多个圆弧线、样条曲线、直线等多个曲线合并成一个曲线。 U型案例 var geometry = new THREE.Geometry(); //声明一个几何体对象Geometry // 绘制一个U型轮廓 var R = 80;//圆弧半径 var arc = new THREE.ArcCurve(0, 0, R, 0, Math.PI, true); // 半圆弧
-
问题内容: 我正在JPanel中绘制两个形状(圆形),我需要用一条 线将它们连接起来。我这样做是通过简单地获得圆的中点并 相互连接来实现的。 问题在于,现在我需要制作单向线,该单向线 的末尾带有“箭头”,以指出线的前进方向。所以现在我不能 使用圆的中点,因为我需要从 边界到边界相互连接,因此“箭头”可以正确显示。 在我上一次尝试的结果是,没有任何好处: PS:在屏幕截图中,我并不是为了看到 直线的