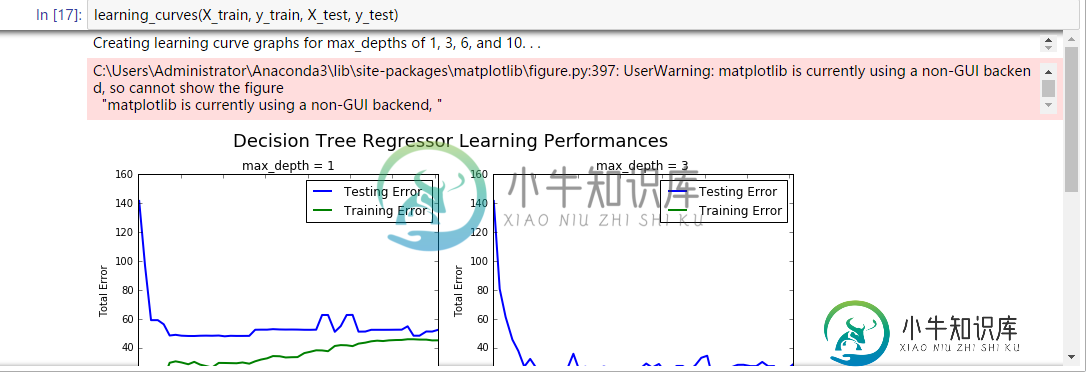
当我在jupyter笔记本中使用matplotlib时,它总是会引发“matplotib当前正在使用非GUI后端”错误?
import matplotlib.pyplot as pl
%matplot inline
def learning_curves(X_train, y_train, X_test, y_test):
""" Calculates the performance of several models with varying sizes of training data.
    The learning and testing error rates for each model are then plotted. """

print ("Creating learning curve graphs for max_depths of 1, 3, 6, and 10. . .")

# Create the figure window
fig = pl.figure(figsize=(10,8))

# We will vary the training set size so that we have 50 different sizes
sizes = np.rint(np.linspace(1, len(X_train), 50)).astype(int)
train_err = np.zeros(len(sizes))
test_err = np.zeros(len(sizes))

# Create four different models based on max_depth
for k, depth in enumerate([1,3,6,10]):

    for i, s in enumerate(sizes):

        # Setup a decision tree regressor so that it learns a tree with max_depth = depth
        regressor = DecisionTreeRegressor(max_depth = depth)

        # Fit the learner to the training data
        regressor.fit(X_train[:s], y_train[:s])

        # Find the performance on the training set
        train_err[i] = performance_metric(y_train[:s], regressor.predict(X_train[:s]))

        # Find the performance on the testing set
        test_err[i] = performance_metric(y_test, regressor.predict(X_test))

    # Subplot the learning curve graph
    ax = fig.add_subplot(2, 2, k+1)

    ax.plot(sizes, test_err, lw = 2, label = 'Testing Error')
    ax.plot(sizes, train_err, lw = 2, label = 'Training Error')
    ax.legend()
    ax.set_title('max_depth = %s'%(depth))
    ax.set_xlabel('Number of Data Points in Training Set')
    ax.set_ylabel('Total Error')
    ax.set_xlim([0, len(X_train)])

# Visual aesthetics
fig.suptitle('Decision Tree Regressor Learning Performances', fontsize=18, y=1.03)
fig.tight_layout()
fig.show()
当我运行learning_curves()函数时,它显示:
user warning:C:\ Users \ Administrator \ anaconda 3 \ lib \ site-packages \ matplotlib \ figure . py:397:user warning:matplotlib当前正在使用非GUI后端,因此无法显示该图

共有3个答案
您可以通过包括以下方式更改matplotlib使用的后端:
import matplotlib
matplotlib.use('TkAgg')
在第 1 行之前,将 matplotlib.pyplot 导入为 pl,因为它必须首先设置。有关详细信息,请参阅此答案。
(还有其他后端选项,但当我遇到类似问题时,将后端更改为TkAgg对我有效)
导入时内联添加%matplotlib有助于在笔记本中平滑绘图
%matplotlib inline
import matplotlib.pyplot as plt
%matplotlib inline 将 matplotlib 的后端设置为“inline”后端:使用此后端,绘图命令的输出以内联方式显示在前端(如 Jupyter 笔记本)中,直接位于生成它的代码单元下方。然后,生成的绘图也将存储在笔记本文档中。
你不需要“fig.show()”这一行。只需将其删除即可。那么它将没有警告消息。
-
我在 函数上遇到了问题。我在Linux上使用PyCharm,我有一个VirtualEnv。当我在 PyCharm 的内置终端(使用 venv)中执行文件 x.py 时,如下所示 Pythonx.py 一切正常,函数<code>plt。show()渲染并显示绘制的图形。我确实添加了来查看默认使用的后端,结果是GTK3Agg。 当我使用选项运行而不是终端时,问题就开始了。然后我收到一条错误消息 用户警
-
根据Hibernate文档,在Hibernate抛出异常后使用会话是不安全的。 如果会话抛出异常,包括任何SQLException,立即回滚数据库事务,调用Session.close()并放弃会话实例。某些会话方法不会使会话处于一致状态。Hibernate抛出的任何异常都不能被视为可恢复的。确保通过在finally块中调用close()来关闭会话。 在我的代码中,我正在做批量插入。我正在使用会话。
-
我正在尝试使用pyplot绘制一个简单的图形,例如: 但该图并未显示,我收到以下信息: 我在几个地方看到,必须使用以下方法更改matplotlib的配置: 我这样做了,但随后收到一条错误消息,因为它找不到模块: 然后,我尝试使用(在虚拟环境中)安装“tkinter”,但它没有找到它: 我还应该提到的是,我正在使用虚拟环境在Py魅力社区版IDE上运行所有这些,我的操作系统Linux /Ubuntu1
-
我试图用pyplot绘制一个简单的图,例如: 但该图没有出现,我得到以下消息: 我在几个地方看到,必须使用以下方法更改matplotlib的配置: 我这样做了,但随后得到一个错误消息,因为它找不到模块: 然后,我尝试使用 (在虚拟环境中)安装“tkinter”,但它没有找到它: 我还应该提到,我正在使用虚拟环境在Pycharm Community Edition IDE上运行所有这些,并且我的操作
-
我在Windows 10上运行Anaconda,并使用Jupyter Notebook进行机器学习项目。 我最近开始意识到Conda中的虚拟环境。 我使用以下命令在conda中创建了一个虚拟环境 激活环境 ipykernel中安装的环境(不确定使用的术语是否正确) 现在环境是可见的jupyter笔记本,但当我启动它我得到
-
在Anaconda Navigator中,我切换到在tensorflow上运行应用程序,并安装了jupyter 5.6.0。然后我打开一个蟒蛇3笔记本。然后我导入tensorflow、keras和numpy,没有问题。然后,当我尝试导入matplotlib时,笔记本上显示ImportError:没有名为“matplotlib”的模块。 在激活tensorflow后,我尝试在我的anaconda提示

