
处理中如何手工将矩阵堆栈应用于坐标

在处理过程中,当您应用矩阵变换时,您可以在画布上绘制,而不必担心x-y坐标的“真实”位置。
我认为按照同样的逻辑,我可以通过使用parentapplet.get(x,y,width,height)复制画布的一部分,它会自动移动x和y,但它不会,它使用坐标作为原始输入,而不对其应用矩阵堆栈。
因此,我认为处理这个问题的最简单方法是手动将矩阵堆栈应用于x、y、width和height值,并将结果用作get()的输入。但是我找不到这样的函数,存在吗?
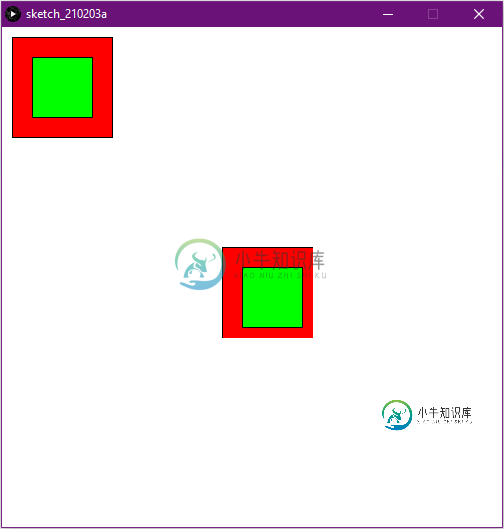
编辑:根据要求,这里有一个我的问题的例子
void settings(){
    size(500, 500);
}

void draw() {
  background(255);

  // Fancy rectangle for visibility
  fill(255, 0 ,0);
  rect(0, 0, 100, 100);
  fill(0, 255, 0);
  rect(20, 20, 60, 60);

  // copy rectangle and paste it elsewhere
  PImage img = get(0, 0, 101, 101);
  image(img, 200, 200);
}

void settings(){
    size(500, 500);
}

void draw() {
  background(255);
  pushMatrix();
  translate(10, 10);

  // Fancy rectangle for visibility
  fill(255, 0 ,0);
  rect(0, 0, 100, 100);
  fill(0, 255, 0);
  rect(20, 20, 60, 60);

  // copy rectangle and paste it elsewhere
  PImage img = get(0, 0, 101, 101);
  image(img, 200, 200);

  popMatrix();
}
共有1个答案

你能提供更多的细节吗。可以使用pushMatrix()/popmatrix()来操纵坐标系,您还可以进一步手动将矩阵和向量相乘。
令人困惑的是,您调用了get(x,y,width,height),但没有显示如何呈现pimage部分。很难猜出你提到的矩阵堆栈。你能发布一个示例片段吗?
如果以相同的x,y来呈现它,则调用get(),它应该以相同的x,y移位来呈现:
size(640, 360);
noFill();
strokeWeight(9);

PImage placeholderForPGraphics = loadImage("https://processing.org/examples/moonwalk.jpg");
image(placeholderForPGraphics, 0, 0);

int x = 420;
int y = 120;
int w = 32;
int h = 48;
// visualise region of interest
rect(x, y, w, h);

// grab the section sub PImage
PImage section = placeholderForPGraphics.get(x, y, w, h);

//filter the section to make it really standout
section.filter(THRESHOLD);
// display section at same location
image(section, x, y);
PMatrix m = g.getMatrix();
printArray(m.get(new float[]{}));
(g.printmatrix()应该更容易打印到控制台,但是如果需要操作实例,则需要调用getmatrix())
其中g是您的PGraphics实例。
然后您可以随意操作它:
m.translate(10, 20);
m.rotate(radians(30));
m.scale(1.5);
g.applyMatrix(m);
size(640, 360);
noFill();
strokeWeight(9);
// get the current transformation matrix
PMatrix m = g.getMatrix();
// print to console
println("before");
g.printMatrix();
// modify it
m.translate(160, 90);
m.scale(0.5);
// apply it
g.applyMatrix(m);
// print applied matrix
println("after");
g.printMatrix();


PImage placeholderForPGraphics = loadImage("https://processing.org/examples/moonwalk.jpg");
image(placeholderForPGraphics, 0, 0);

int x = 420;
int y = 120;
int w = 32;
int h = 48;
// visualise region of interest
rect(x, y, w, h);

// grab the section sub PImage
PImage section = placeholderForPGraphics.get(x, y, w, h);

//filter the section to make it really standout
section.filter(THRESHOLD);
// display section at same location
image(section, x, y);
void setup(){
  size(360, 360);

  // draw something manipulating the coordinate system
  PGraphics pg = createGraphics(360, 360);
  pg.beginDraw();
  pg.background(0);
  pg.noFill();
  pg.stroke(255, 128);
  pg.strokeWeight(4.5);
  pg.rectMode(CENTER);
  pg.translate(180,180);
  for(int i = 0 ; i < 72; i++){
    pg.rotate(radians(5));
    pg.scale(0.95);
    //pg.rect(0, 0, 320, 320, 32, 32, 32, 32);
    polygon(6, 180, pg);
  }
  pg.endDraw();

  // render PGraphics
  image(pg, 0, 0);

  }
void setup(){
  size(360, 360);

  // draw something manipulating the coordinate system
  PGraphics pg = createGraphics(360, 360);
  pg.beginDraw();
  pg.background(0);
  pg.noFill();
  pg.stroke(255, 128);
  pg.strokeWeight(4.5);
  pg.rectMode(CENTER);
  pg.translate(180,180);
  for(int i = 0 ; i < 72; i++){
    pg.rotate(radians(5));
    pg.scale(0.95);
    //pg.rect(0, 0, 320, 320, 32, 32, 32, 32);
    polygon(6, 180, pg);
  }
  pg.endDraw();

  // render PGraphics
  image(pg, 0, 0);


  // take a section of PGraphics instance
  int w = 180;
  int h = 180;
  int x = (pg.width - w) / 2;
  int y = (pg.height - h) / 2;
  PImage section = pg.get(x, y, w, h);

  // filter section to emphasise
  section.filter(INVERT);

  // render section at sampled location
  image(section, x, y);
  popMatrix();

}

void polygon(int sides, float radius, PGraphics pg){
  float angleIncrement = TWO_PI / sides;
  pg.beginShape();
  for(int i = 0 ; i <= sides; i++){
    float angle = (angleIncrement * i) + HALF_PI;
    pg.vertex(cos(angle) * radius, sin(angle) * radius);
  }
  pg.endShape();
}
下面是最后一个迭代,在一个独立的坐标空间中重新应用最后一个转换矩阵(使用push/pop矩阵调用):
void setup(){
  size(360, 360);

  // draw something manipulating the coordinate system
  PGraphics pg = createGraphics(360, 360);
  pg.beginDraw();
  pg.background(0);
  pg.noFill();
  pg.stroke(255, 128);
  pg.strokeWeight(4.5);
  pg.rectMode(CENTER);
  pg.translate(180,180);
  for(int i = 0 ; i < 72; i++){
    pg.rotate(radians(5));
    pg.scale(0.95);
    //pg.rect(0, 0, 320, 320, 32, 32, 32, 32);
    polygon(6, 180, pg);
  }
  pg.endDraw();

  // render PGraphics
  image(pg, 0, 0);

  // take a section of PGraphics instance
  int w = 180;
  int h = 180;
  int x = (pg.width - w) / 2;
  int y = (pg.height - h) / 2;
  PImage section = pg.get(x, y, w, h);

  // filter section to emphasise
  section.filter(INVERT);

  // print last state of the transformation matrix
  pg.printMatrix();

  // get the last matrix state
  PMatrix m = pg.getMatrix();
  // isolate coordinate space
  pushMatrix();
  //apply last PGraphics matrix
  applyMatrix(m);
  // render section at sampled location
  image(section, x, y);
  popMatrix();

  save("state3.png");
}

void polygon(int sides, float radius, PGraphics pg){
  float angleIncrement = TWO_PI / sides;
  pg.beginShape();
  for(int i = 0 ; i <= sides; i++){
    float angle = (angleIncrement * i) + HALF_PI;
    pg.vertex(cos(angle) * radius, sin(angle) * radius);
  }
  pg.endShape();
}
这是一个极端的例子,因为0.95downscale应用了72次,因此呈现的图像非常小。还要注意旋转是递增的。
根据您的更新代码片段,似乎在pushmatrix()和get()之间存在混淆。
int sampleX = 10;
int sampleY = 10;

void settings(){
    size(500, 500);
}

void draw() {
  background(255);
  pushMatrix();
  translate(sampleX, sampleY);

  // Fancy rectangle for visibility
  fill(255, 0 ,0);
  rect(0, 0, 100, 100);
  fill(0, 255, 0);
  rect(20, 20, 60, 60);

  // copy rectangle and paste it elsewhere
  PImage img = get(sampleX, sampleY, 101, 101);
  image(img, 200, 200);

  popMatrix();
}
void settings(){
    size(500, 500);
}

void setup() {
  background(255);
  pushMatrix();
  translate(10, 10);
  // Fancy rectangle for visibility
  fill(255, 0 ,0);
  rect(0, 0, 100, 100);
  fill(0, 255, 0);
  rect(20, 20, 60, 60);
  // local to global coordinate conversion using PMatrix
  // g is the global PGraphics instance every PApplet (sketch) uses
  PMatrix m = g.getMatrix();
  printArray(m.get(null));
  // the point in local coordinate system
  PVector local = new PVector(0,0);
  // multiply local point by transformation matrix to get global point
  // we pass in null to get a new PVector instance: you can make this more efficient by allocating a single PVector ad re-using it instead of this basic demo
  PVector global = m.mult(local,null);
  // copy rectangle and paste it elsewhere
  println("local",local,"->global",global);
  PImage img = get((int)global.x, (int)global.y, 101, 101);
  image(img, 200, 200);

  popMatrix();
}
要根据变换矩阵计算向量的位置,只需将向量乘以该矩阵。非常粗略地说,Push/Pop矩阵会发生什么(每个Push/Pop堆栈使用一个转换矩阵,然后将其乘以全局坐标系)。(请注意效率/预先分配矩阵和向量的注释)。
就代码而言,这将更加冗长,如果您使用大量html" target="_blank">嵌套转换,则可能需要进行一些规划,但您可以更好地控制选择使用哪些转换。
一个更简单的解决方案是切换到P3DOpenGL呈现器,它允许您使用screenx()、screeny()进行转换。(也签出modelx()/modely())
void settings(){
    size(500, 500, P3D);
}

void draw() {
  background(255);
  pushMatrix();
  translate(10, 10);
  // Fancy rectangle for visibility
  fill(255, 0 ,0);
  rect(0, 0, 100, 100);
  fill(0, 255, 0);
  rect(20, 20, 60, 60);
  // local to global coordinate conversion using modelX,modelY
  float x = screenX(0, 0, 0);
  float y = screenY(0, 0, 0);
  println(x,y);
  PImage img = get((int)x, (int)y, 101, 101);
  image(img, 200, 200);

  popMatrix();
}
请记住,您想抓取一个简单地应用了翻译的矩形。由于get()不会考虑旋转/缩放,因此对于更复杂的情况,您可能不仅需要将左上角的坐标转换为全局坐标,还需要将右下角的坐标转换为具有偏移量的坐标。其思想是在转换后的框周围计算更大的边界框(没有旋转),这样当调用get()时,将返回整个感兴趣的区域(而不仅仅是一个剪裁的部分)。
-
问题内容: 我有一个2D矩阵,我想对每一行进行规范。但是当我直接使用时,它将采用整个矩阵的范数。 我可以使用for循环对每一行进行规范,然后对each进行规范,但是由于我有3万行,因此这需要花费大量时间。 有什么建议可以找到更快的方法吗?还是可以将其应用于矩阵的每一行? 问题答案: 请注意,如perimosocordiae所示,从NumPy1.9版本开始,这是计算L2-范数的最快方法。 由于num
-
我是python的新手,在处理矩阵时遇到了一个问题。 我有一个矩阵,比方说 现在,我想让矩阵中的所有元素都等于零,除了在矩阵中重复最多次的元素。(在这种情况下,它是3)。 所以预期的结果是, 如果有人能帮我做这个的python代码,那真的很有帮助。
-
我正在处理3.3中制作一个矩阵文本雨效果,作为学习处理库和Java的简单入门项目。到目前为止,我的代码: 好的,那是很多代码,让我解释一下我的困境。我遇到的问题是,当我运行代码时,我在渲染函数中的每个循环中得到一个NullpointerExctive在方法调用。关于这个NullPointerExctive错误的奇怪部分和我不理解的部分是,它被抛在一个不接受任何可能返回空参数的方法上,并且该方法本身
-
我正在创建3D/2D图形引擎,我写了一些花哨的Vector2、Vector3类、窗口包装器和OpenGL上下文创建框架,有一段时间我在想如何切换坐标系轴。在OpenGL中,默认情况是这样的(据我所知): 我真的,真的不想有那样的coords,这只会让我无法阅读coords。所以我想到了UE4风格的坐标: 我读过关于“调整”视角的书,但只有倒转轴,没有切换它们。 我的第二个问题是我在哪里可以学习一些
-
问题内容: 我想将图像的颜色基础从RGB更改为其他颜色。我有一个要应用于每个像素的RGB的矩阵M,我们可以将其定义为x ij。 我目前正在迭代NumPy图像的每个像素并手动计算Mx ij。我什至无法对它们进行矢量化处理,因为RGB是1x3而不是3x1数组。 有一个更好的方法吗?也许是OpenCV或NumPy中的函数? 问题答案: 记不清执行此操作的规范方法(可能避免了转置),但这应该可行: 如果是
-
我需要点子,这不是家庭作业...... 我有下面的矩阵,我如何获得重复数字的坐标, 重复项[[[0,0],[1,0],[2,0],[0,1],[0,1],[0,2],[1,2],[1,3],[2,2]],[[0,3],[0,4],.........] 第1组,分离2组,分离3组,仅2组 重复项[[[0,0],[1,0],[2,0],[0,1],[0,2],[1,2],[1,3],[2,2]],[[