
如何在Matplotlib中使用按钮在两个不同的图形之间切换

我有两个不同的matplotlib图,我想在按下按钮时进行切换。当按下按钮时,我拥有的代码会将第二张图添加到第一张图的下面,但是我希望它替换第一张图。这是一个有点类似的stackoverflow问题(如何更新嵌入到tkinter中的matplotlib?),但我似乎无法将其应用于我的情况。
我编写的图形graph_one和graph_two是我从matplotlib文档中提取的两个简单图形。在我的实际使用中,我有两个非常不同的非常复杂的图,一个是单个图,另一个是另外的子图。因为我希望在图之间来回切换的图是如此不同,所以对我来说重要的是,该解决方案能够将图输入作为单独的定义来处理。还应注意,我的图已嵌入tkinter小部件中,解决方案也应考虑此嵌入,这一点很重要。这是我的代码:
import matplotlib
matplotlib.use("TkAgg")
import matplotlib.pyplot as plt
import numpy as np
from tkinter import *
from matplotlib.backends.backend_tkagg import (
    FigureCanvasTkAgg, NavigationToolbar2Tk)
# Implement the default Matplotlib key bindings.
from matplotlib.backend_bases import key_press_handler


def graph_one():
    t = np.arange(0.0, 2.0, 0.01)
    s = 1 + np.sin(2 * np.pi * t)

    fig, ax = plt.subplots()
    ax.plot(t, s)

    ax.set(xlabel='time (s)', ylabel='voltage (mV)',
           title="Graph One")

    #plt.show()
    return fig


def graph_two():
    t = np.arange(0.0, 2.0, 0.01)
    s = 1 + np.cos(2 * np.pi * t)

    fig, ax = plt.subplots()
    ax.plot(t, s)

    ax.set(xlabel='time (s)', ylabel='voltage (mV)',
           title="Graph Two")

    #plt.show()
    return fig

class matplotlibSwitchGraphs:
    def __init__(self, master):
        self.master = master
        self.frame = Frame(self.master)
        self.embed_graph_one()
        self.frame.pack(expand=YES, fill=BOTH)

    def embed_graph_one(self):

        fig = graph_one()

        canvas = FigureCanvasTkAgg(fig, self.master)
        canvas.get_tk_widget().pack(side=TOP, fill=BOTH, expand=1)
        canvas.draw()

        canvas.mpl_connect("key_press_event", self.on_key_press)

        toolbar = NavigationToolbar2Tk(canvas, self.master)
        toolbar.update()
        canvas.get_tk_widget().pack(side=TOP, fill=BOTH, expand=1)


        self.button = Button(self.master, text="Quit",
command=self._quit)
        self.button.pack(side=BOTTOM)
        self.button_switch = Button(self.master, text="Switch Graphs",
command=self.switch_graphs)
        self.button_switch.pack(side=BOTTOM)

    def embed_graph_two(self):

        fig = graph_two()

        canvas = FigureCanvasTkAgg(fig, self.master)
        canvas.draw()
        canvas.get_tk_widget().pack(side=TOP, fill=BOTH, expand=1)

        canvas.mpl_connect("key_press_event", self.on_key_press)

        toolbar = NavigationToolbar2Tk(canvas, self.master)
        toolbar.update()
        canvas.get_tk_widget().pack(side=TOP, fill=BOTH, expand=1)


        self.button = Button(self.master, text="Quit",
command=self._quit)
        self.button.pack(side=BOTTOM)
        self.button_switch = Button(self.master, text="Switch Graphs",
command=self.switch_graphs)
        self.button_switch.pack(side=BOTTOM)


    def on_key_press(event):
        print("you pressed {}".format(event.key))
        key_press_handler(event, canvas, toolbar)

    def _quit(self):
        self.master.quit()  # stops mainloop

    def switch_graphs(self):
        self.embed_graph_two()

def main():
    root = Tk()
    matplotlibSwitchGraphs(root)
    root.mainloop()


if __name__ == '__main__':
    main()
看来我应该能够使用类似的命令
ax.clear()
在switch_graphs def中清除第一张图,但这不起作用。任何帮助,将不胜感激。
我将发布更新的代码,以显示我已取得的一些小进展,以及更好地表示我希望在其间切换的两个图表的不同性质。这两个图仍然是直接从matplotlib文档中直接获取的简单图,但它们更好地表示我的一个图是单个图,而第二个图则有两个图直接位于彼此之上。
在我的实际情况下,我试图使用一个按钮来在带有交易量叠加的烛台图表和没有交易量叠加的烛台图表之间切换。发布所有代码以显示烛台图将花费很长的代码,因此我通过使用这些更简单的图形进行了简化。为了简单起见,我还取消了matplotlib的导航工具栏。这是我的修改代码:
import matplotlib
matplotlib.use("TkAgg")
import matplotlib.pyplot as plt
import numpy as np
from html" target="_blank">tkinter import *
from matplotlib.backends.backend_tkagg import (
    FigureCanvasTkAgg, NavigationToolbar2Tk)
# Implement the default Matplotlib key bindings.
from matplotlib.backend_bases import key_press_handler


class matplotlibSwitchGraphs:
    def __init__(self, master):
        self.master = master
        self.frame = Frame(self.master)
        self.embed_graph_one()
        self.frame.pack(expand=YES, fill=BOTH)

    # the def creates the first matplotlib graph
    def graph_one(self):
        t = np.arange(0.0, 2.0, 0.01)
        s = 1 + np.sin(2 * np.pi * t)

        fig, ax = plt.subplots()
        ax.plot(t, s)

        ax.set(xlabel='time (s)', ylabel='voltage (mV)',
               title="Graph One")

        # plt.show()
        return fig, ax

    # This def creates the second matplotlib graph that uses subplot
    # to place two graphs one on top of the other
    def graph_four(self):
        x1 = np.linspace(0.0, 5.0)
        y1 = np.cos(2 * np.pi * x1) * np.exp(-x1)
        fig = plt.figure()
        ax = plt.subplot2grid((5, 4), (0, 0), rowspan=4, colspan=4)
        ax.plot(x1, y1, 'o-')

        means_men = (20, 35, 30, 35, 27)
        std_men = (2, 3, 4, 1, 2)
        ax2 = plt.subplot2grid((5, 4), (4, 0), sharex=ax, rowspan=1,
colspan=4)
        ax2.bar(std_men, means_men, color='green', width=0.5,
align='center')

        return fig, ax

    # this def takes graph one and embeds it in a tkinter widget
    def embed_graph_one(self):

        fig, ax = self.graph_one()

        canvas = FigureCanvasTkAgg(fig, self.master)
        canvas.get_tk_widget().pack(side=TOP, fill=BOTH, expand=1)
        canvas.draw()

        canvas.mpl_connect("key_press_event", self.on_key_press)


        self.button = Button(self.master, text="Quit",
command=self._quit)
        self.button.pack(side=BOTTOM)
        self.button_switch = Button(self.master, text="Switch Graphs",
command=lambda: self.switch_graphs(canvas, fig, ax))
        self.button_switch.pack(side=BOTTOM)


    # This def takes the second graph and embeds it in a tkinter
    # widget
    def embed_graph_two(self):

        fig, ax = self.graph_two()

        canvas = FigureCanvasTkAgg(fig, self.master)
        canvas.draw()
        canvas.get_tk_widget().pack(side=TOP, fill=BOTH, expand=1)

        canvas.mpl_connect("key_press_event", self.on_key_press)


        self.button = Button(self.master, text="Quit",
command=self._quit)
        self.button.pack(side=BOTTOM)
        self.button_switch = Button(self.master, text="Switch Graphs",
command=lambda: self.switch_graphs(canvas, fig, ax))
        self.button_switch.pack(side=BOTTOM)

    # the def defines the key press event handler
    def on_key_press(event):
        key_press_handler(event, canvas, toolbar)

    # This def quits the tkinter widget
    def _quit(self):
        self.master.quit()  # stops mainloop

    # This def switches between the two embedded graphs
    def switch_graphs(self, fig, canvas, ax):
        ax.clear()
        self.embed_graph_two()
        canvas.draw()


def main():
    root = Tk()
    matplotlibSwitchGraphs(root)
    root.mainloop()


if __name__ == '__main__':
    main()
这段代码仍然不会用第二张图代替第一张图,而只是将第二张图放在第一张图的下方。任何获取此代码以用第二个图形替换第一个图形的帮助将不胜感激。
我正在绘制的图形是OHLC烛台图和带有体积叠加的OHLC烛台图。不幸的是
self.canvas.draw()
draw_graph
defs中的命令似乎不适用于此处。当我尝试显示图形时,我得到的只是一个空白图。这是我使用的绘制烛台图的代码。这将对应于draw_graph_one。
def ohlc_daily_date_axis(self, stock_sym):
    mondays = WeekdayLocator(MONDAY)  # major ticks on the mondays
    alldays = DayLocator()  # minor ticks on the days
    weekFormatter = DateFormatter('%b %d %Y')  # e.g., Jan 12 2018
    dayFormatter = DateFormatter('%d')  # e.g., 12

    quotes = get_stock_price_data_list_of_tuples(stock_sym)
    graph_header_text = 'Daily OHLC Candlestick Chart: ' + stock_sym + ' Date Range: ' + str(
        num2date(quotes[0][0]).date()) + ' - ' + str(num2date(quotes[-1][0]).date())

    if len(quotes) == 0:
        raise SystemExit

    self.fig, self.ax = plt.subplots(figsize=(18, 5))
    plt.subplots_adjust(bottom=0.2)
    self.ax.xaxis.set_major_locator(mondays)
    self.ax.xaxis.set_minor_locator(alldays)
    self.ax.xaxis.set_major_formatter(weekFormatter)
    # ax.xaxis.set_minor_formatter(dayFormatter)
    plt.title(graph_header_text)
    self.ax.set_ylabel('Share Price ($)', size=10)

    # plot_day_summary(ax, quotes, ticksize=3)
    candlestick_ohlc(self.ax, quotes, width=0.6)

    self.ax.xaxis_date()
    self.ax.autoscale_view()
    plt.setp(plt.gca().get_xticklabels(), rotation=45, horizontalalignment='right')
    self.ax.format_coord = self.get_ohlc_from_date_xy
    # ax.fmt_xdata = get_ohlc_from_date_x

    #plt.show()
    self.canvas.draw()
我将如何修改它以使其显示数据?
问题答案:
包含Tk嵌入的新答案(与其他答案相比有重大变化,因此添加新答案而不是编辑该答案)。我感动graph_one()和graph_two()进开关图包装类,并将其重命名为draw_graph_one()和draw_graph_two()。这两个新的类方法替换了embed_graph_one()和embed_graph_two()方法。embed()方法中的大多数内容都是重复的,因此被移动到config_window()实例化类对象时调用的方法。创建了一些类的数据成员捕捉PLT变量(例如canvas,ax,fig),并创建了一个新的数据成员来跟踪其当前显示图(graphIndex),以便我们能够正确得出正确的图形时switch_graphs()被调用(而不是调用embed_graph_two()每次进行“切换”(如原始代码一样)。(可选)您可以t从draw方法中取出并使其成为类数据成员(如果的值t不变)。
import matplotlib
matplotlib.use("TkAgg")
import matplotlib.pyplot as plt
import numpy as np
from tkinter import *
from matplotlib.backends.backend_tkagg import (
    FigureCanvasTkAgg, NavigationToolbar2Tk)
# Implement the default Matplotlib key bindings.
from matplotlib.backend_bases import key_press_handler

# Seperated out config of plot to just do it once
def config_plot():
    fig, ax = plt.subplots()
    ax.set(xlabel='time (s)', ylabel='voltage (mV)',
           title="Graph One")
    return (fig, ax)

class matplotlibSwitchGraphs:
    def __init__(self, master):
        self.master = master
        self.frame = Frame(self.master)
        self.fig, self.ax = config_plot()
        self.graphIndex = 0
        self.canvas = FigureCanvasTkAgg(self.fig, self.master)
        self.config_window()
        self.draw_graph_one()
        self.frame.pack(expand=YES, fill=BOTH)

    def config_window(self):
        self.canvas.mpl_connect("key_press_event", self.on_key_press)
        toolbar = NavigationToolbar2Tk(self.canvas, self.master)
        toolbar.update()
        self.canvas.get_tk_widget().pack(side=TOP, fill=BOTH, expand=1)
        self.button = Button(self.master, text="Quit", command=self._quit)
        self.button.pack(side=BOTTOM)
        self.button_switch = Button(self.master, text="Switch Graphs", command=self.switch_graphs)
        self.button_switch.pack(side=BOTTOM)

    def draw_graph_one(self):
        t = np.arange(0.0, 2.0, 0.01)
        s = 1 + np.sin(2 * np.pi * t)
        self.ax.clear() # clear current axes
        self.ax.plot(t, s)
        self.ax.set(title="Graph One")
        self.canvas.draw()

    def draw_graph_two(self):
        t = np.arange(0.0, 2.0, 0.01)
        s = 1 + np.cos(2 * np.pi * t)
        self.ax.clear()
        self.ax.plot(t, s)
        self.ax.set(title="Graph Two")
        self.canvas.draw()

    def on_key_press(event):
        print("you pressed {}".format(event.key))
        key_press_handler(event, self.canvas, toolbar)

    def _quit(self):
        self.master.quit()  # stops mainloop

    def switch_graphs(self):
        # Need to call the correct draw, whether we're on graph one or two
        self.graphIndex = (self.graphIndex + 1 ) % 2
        if self.graphIndex == 0:
            self.draw_graph_one()
        else:
            self.draw_graph_two()

def main():
    root = Tk()
    matplotlibSwitchGraphs(root)
    root.mainloop()

if __name__ == '__main__':
    main()
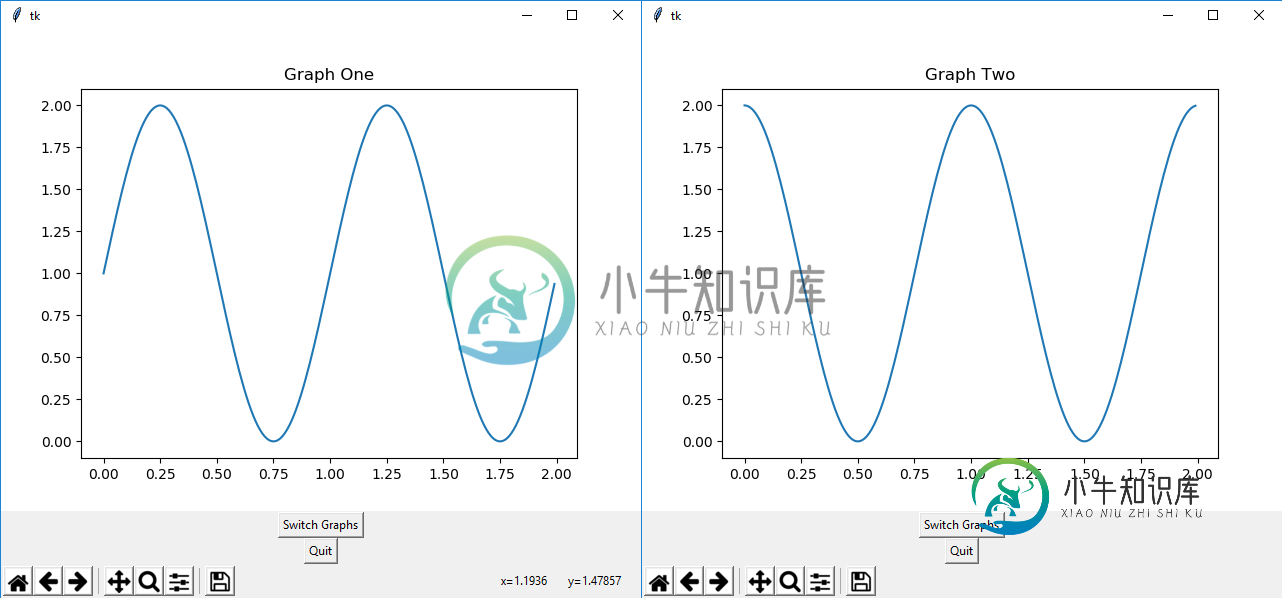
输出(两个窗口,每当单击切换图按钮时交替显示):
-
问题内容: 我正在用Matplotlib绘制两个子图,基本上如下: 我可以在这两个子图之间画线吗?我该怎么办? 问题答案: 在许多情况下,其他答案的解决方案不是最优的(因为它们只有在计算出点数后未对图进行任何更改的情况下才会起作用)。 更好的解决方案将使用特别设计的:
-
问题内容: 我正在尝试覆盖默认外观。这是定义的XML : 现在,我们有两个要用于单击/未单击状态的30 x 30图标。现在,我们有一些代码,可以根据状态以编程方式更改背景图标: 显然,我正在寻找一种更好的方法来做到这一点。我试图为背景图片创建一个选择器,该选择器将在状态之间自动切换: 但这是行不通的。阅读API(http://developer.android.com/reference/andr
-
问题内容: 我想在Python中的两个值之间切换,即0到1之间。 例如,当我第一次运行一个函数时,它产生数字0。下一次,它产生1。第三次它返回零,依此类推。 抱歉,如果这样做没有道理,但是有人知道这样做的方法吗? 问题答案: 用途: 请注意,如果您需要比更为复杂的周期,那么此解决方案将比此处发布的其他解决方案更具吸引力。
-
问题内容: 我一组有四个按钮。这只是两个示例,因为它们都是重复的代码。我想在每个按钮之间创建一个很小的空间,以免它们彼此碰到。我几乎尝试了中的所有方法,但没有任何效果。 问题答案: 如果要在组件之间留有空间,则可以为一个或两个组件添加一个空边框,或插入不可见的组件以提供空间。您可以在Box类的帮助下创建不可见的组件。 由于您已经使用过胶水,但没有成功(我怀疑为什么吗?),因此您可以尝试使用类似 R
-
两个(切换)按钮是否可能在片段之间具有同步行为?即:当按钮A在片段A中打开时,我希望按钮B在片段B中的外观也显示为打开。 我该怎么做呢?最终目标是在任何一个片段上都有一个全局按钮。
-
我有一个简单的代码,它在两个不同的图(图1和图2)中绘制了完全相同的东西。然而,我必须写一行ax?。绘制(x,y)两次,一次用于ax1,一次用于ax2。我怎么可能只有一个plot表达式(对于我更复杂的代码来说,有多个redondant表达式可能是一个麻烦的来源)。类似于ax1、ax2。绘图(x,y)?