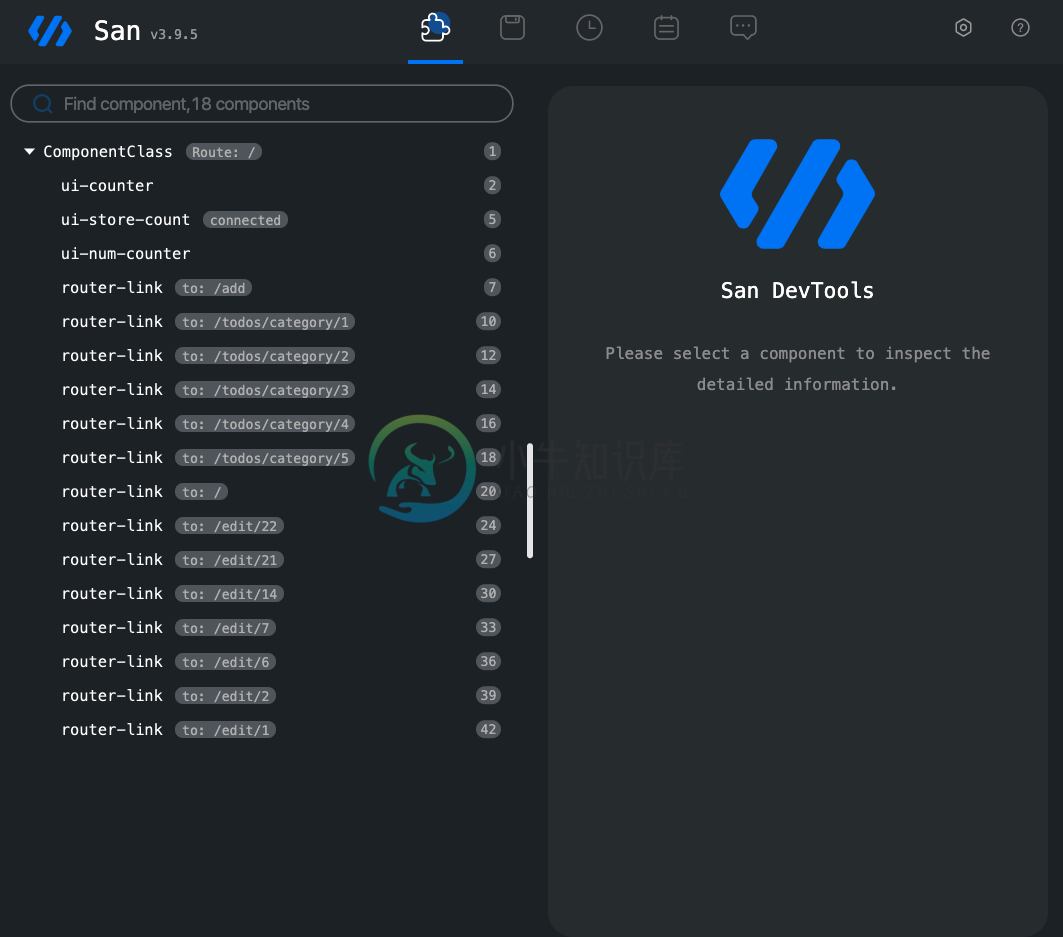
San DevTools
优质
小牛编辑
132浏览
2023-12-01
中文文档:https://www.xnip.cn/article/san-devtools-use.html
It is exists both as a browser extension and as a common line tool(works with other environments including Safari, IE, San Native and Electron.)
Features
- Provide local server command, support remote debugging.
- Built in Chrome Devtools for remote debug mobile page.
- Provide Chrome Extension.
- Support
San Nativedebugging (waiting for release).
Installation
standalone
The standalone version exists as a command line tool, and install from NPM or Yarn.
npm i -g san-devtools
# OR
yarn global add san-devtools
chrome extension
OR
Navigate to chrome://extensions in Chrome/Chromium to load the unpacked extension from dist directory.
Quick Start
standalone
First: Start debugging server, and will auto open the remote inspector.
sand # short for san-devtools
# OR
san-devtools
Second: Add ws-backend.js to the top of the debugging page(before san.js).
Third: Open the debugging page, and inspector page will auto connected.
chrome extension
Open the debugging page and san-devtools plugin will show the San version, then open the chrome devtool and will see the San tab.
sand options
- --open, -o: Open browser when server start(default: true)
- --port, -p: Port to use (default: 8899)
- --address, -a: Address to use
- --version, -v: Show version number
- --help, -h: Show help


