kableExtra 
When we are talking about table generators in R, knitr's kable() function is usually a popular choice because of its ultimate simplicity. Unlike those powerful table rendering engines such as xtable, the philosophy behind knitr::kable() is to make it easy for programmers to use. Just as it claimed in its function description,
This is a very simple table generator. It is simple by design. It is not intended to replace any other R packages for making tables. - Yihui
However, the ultimate simplicity of kable() also brought troubles to some of us, especially for new R users, who may not have a lot of experience on generating tables in R. It is not rare to see people including experienced users asking questions like how to center/left-align a table on Stack Overflow. Also, for me personally, I found myself repeatedly parsing CSS into kable() for some very simple features like striped lines. For LaTeX, it's even worse since I'm almost Stack Overflow dependent for LaTeX... That's why this package kableExtra was created.
I hope with kableExtra, you can
- Use default base
kable()(Or a good alternative for markdown tables ispander::pander()) for all simple tables - Use
kable()withkableExtrato generate 90 % of complex/advanced/self-customized/beautiful tables in either HTML or LaTeX - Only have to mess with raw HTML/LaTeX in the last 10% cases where
kableExtracannot solve the problem
This package can load required LaTeX package automatically in vanilla rmarkdown. For customized rmarkdown templates, it is recommended to load related LaTeX packages manually.
Features
Pipable syntax
kableExtra is NOT a table generating package. It is a package that can "add features" to a kable() output using a syntax that every useR loves - the pipes %>%. We see similar approaches to deal with plots in packages like ggvis and plotly. There is no reason why we cannot use it with tables.
Unified functions for both HTML and PDF
Most functionalities in kableExtra can work in both HTML and PDF. In fact, as long as you specifies format in kable() (which can be set globally through option knitr.table.format), functions in this package will pick the right way to manipulate the table be themselves. As a result, if users want to left align the table, kable(...) %>% kable_styling(position = "left") will work in both HTML and PDF. Recently, we also introduced a new kbl() function acting as an alternative to kable but provides better documentation and format detection.
Install
install.packages("kableExtra")

# For dev version
devtools::install_github("haozhu233/kableExtra")
Basic Usage
library(kableExtra)
dt <- mtcars[1:5, 1:4]

# HTML table
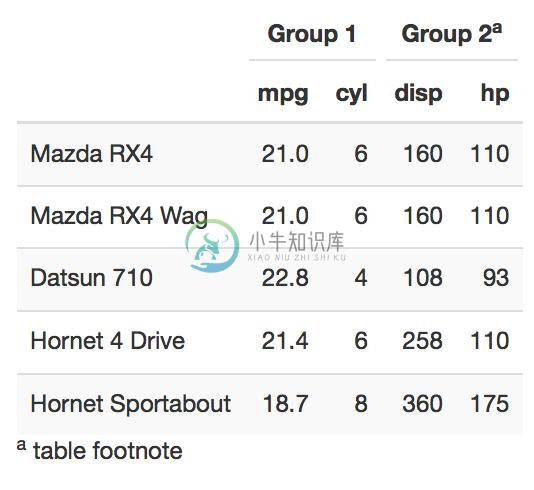
kbl(dt, caption = "Demo Table") %>%
  kable_styling(bootstrap_options = "striped",
                full_width = F) %>%
  add_header_above(c(" ", "Group 1" = 2, "Group 2[note]" = 2)) %>%
  footnote(c("table footnote"))

# LaTeX Table
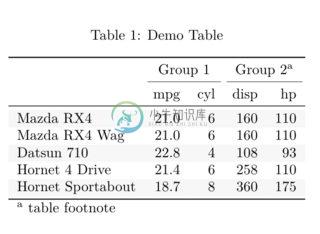
kbl(dt, booktabs = T, caption = "Demo Table") %>%
  kable_styling(latex_options = c("striped", "hold_position"),
                full_width = F) %>%
  add_header_above(c(" ", "Group 1" = 2, "Group 2[note]" = 2)) %>%
  footnote(c("table footnote"))
Results
More Information
For more information, please check the package vignette.
- Create Awesome HTML Table with
knitr::kable()and kableExtra (中文) - Create Awesome LaTeX Table with
knitr::kable()and kableExtra
Acknowledgement
I would like to thank colleagues at Hebrew SeniorLife Marcus Institute for Aging Research and the Boston Pepper Center for their input. I also would like to appreciate the mentorship from Tom Travison (@tgt75) and all the efforts from the open source community, which help this package keep getting better.
-
我使用 kableExtra 格式化Rmarkdown文档中的一些表格 . 当运行下面的代码时, kable_styling 没有任何 position 参数,分组行标签(表中的行显示"Group 1"和"Group 2")和脚注相对于表保持左对齐 . 这是我想要的 . ```{r cars-table, results='asis'} kable(mtcars[1:10, 1:2], forma
-
我使用包在Rmarkdown中创建了下表。我正在寻找一种方法来减少我的脚注的大小。在参数中添加作为参数似乎不起作用。有什么想法吗?
-
我正在使用库和R Markdown,我想为行标签添加脚注(以及其他单元格的次要脚注)。我怎么能那样做? 以下数据示例: 我想给添加一个脚注,第一行的标签(例如)。 有什么想法吗? 提前致谢
-
是否可以在中设置标题格式?当编织到中的时,我希望将表格的标题居中并加粗。我尝试将表包装在一个中,其中文本居中,但这并没有产生预期的结果。 表格示例: 收益率: 我想:
-
这困扰我太久了,我很感激你的帮助。我一直在为kable投入时间,但它并没有像我希望的那样对我产生效果。我希望创建多组行,如图所示 执行此操作的代码如下: 这显然不够好。如果我织成pdf,我可以得到正确的输出(第一张图片),但仅此而已。如果我尝试执行save_kable(),结果显示为HTML格式,如第二幅图像所示。每次都编织成pdf格式是如此不切实际,如果我不能解决这个问题,我就不能再使用kabl


