

An R package for creating interactive web graphics via the open sourceJavaScript graphing libraryplotly.js.
Installation
Install from CRAN:
install.packages("plotly")
Or install the latest development version (on GitHub) via {remotes}:
remotes::install_github("plotly/plotly")
Getting started
Web-based ggplot2 graphics
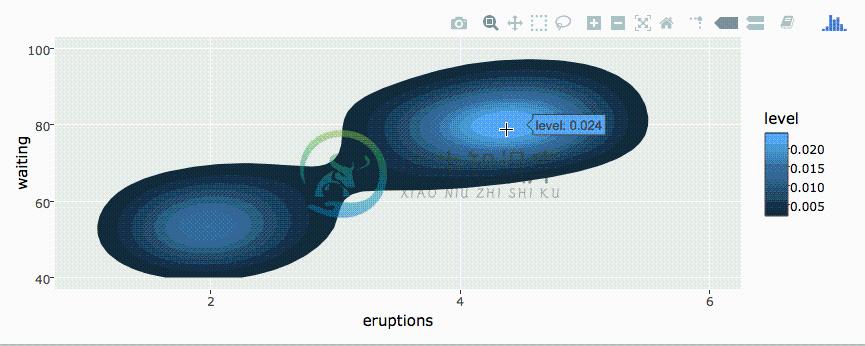
If you use ggplot2, ggplotly()converts your static plots to an interactive web-based version!
library(plotly)
g <- ggplot(faithful, aes(x = eruptions, y = waiting)) +
  stat_density_2d(aes(fill = ..level..), geom = "polygon") +
  xlim(1, 6) + ylim(40, 100)
ggplotly(g)
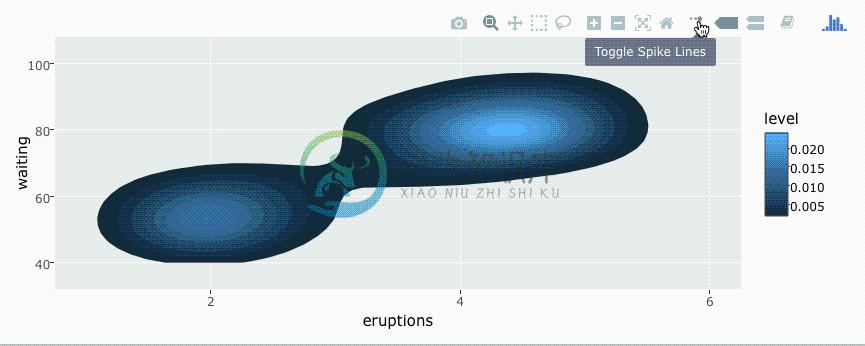
By default, ggplotly() tries to replicate the static ggplot2 versionexactly (before any interaction occurs), but sometimes you need greatercontrol over the interactive behavior. The ggplotly() function itselfhas some convenient “high-level” arguments, such as dynamicTicks,which tells plotly.js to dynamically recompute axes, when appropriate.The style() function also comes in handy for modifying theunderlying traceattributes (e.g. hoveron) used to generate the plot:
gg <- ggplotly(g, dynamicTicks = "y")
style(gg, hoveron = "points", hoverinfo = "x+y+text", hoverlabel = list(bgcolor = "white"))
Moreover, since ggplotly() returns a plotly object, you can applyessentially any function from the R package on that object. Some usefulones include layout() (for customizing thelayout),add_traces() (and its higher-level add_*() siblings, for exampleadd_polygons(), for adding newtraces/data),subplot() (for combining multiple plotlyobjects),and plotly_json() (for inspecting the underlying JSON sent toplotly.js).
The ggplotly() function will also respect some “unofficial”ggplot2 aesthetics, namely text (for customizing thetooltip),frame (for creatinganimations),and ids (for ensuring sensible smooth transitions).
Using plotly without ggplot2
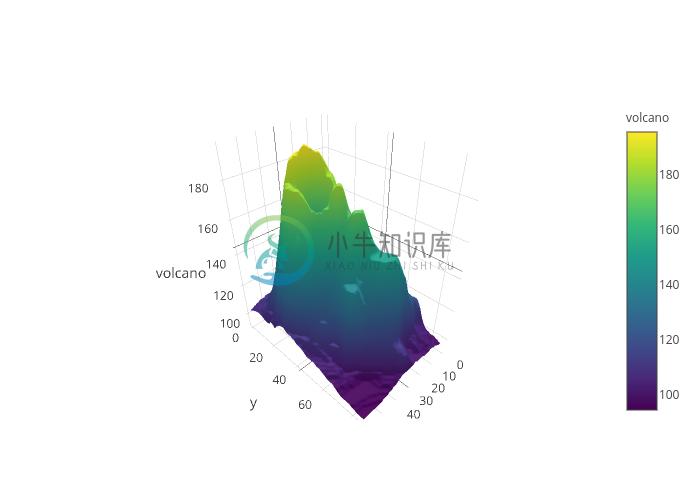
The plot_ly() function provides a more direct interface to plotly.jsso you can leverage more specialized chart types (e.g., parallelcoordinates ormaps) or even some visualization that theggplot2 API won’t ever support (e.g., surface,mesh,trisurf, etc).
plot_ly(z = ~volcano, type = "surface")
Learn more
To learn more about special features that the plotly R package provides (e.g., client-side linking, shiny integration, editing and generating static images, custom events in JavaScript, and more), see https://plotly-r.com. You may already be familiar with existing plotly documentation (e.g., https://plotly.com/r/), which is essentially a language-agnostic how-to guide for learning plotly.js, whereas https://plotly-r.com is meant to be more wholistic tutorial written by and for the R user. The package itself ships with a number of demos (list them by running demo(package = "plotly")) and shiny/rmarkdown examples (list them by running plotly_example("shiny") or plotly_example("rmd")). Carson also keeps numerous slide decks with useful examples and concepts.
Contributing
Please read through our contributingguidelines.Included are directions for opening issues, asking questions,contributing changes to plotly, and our code ofconduct.

-
我试图在Jupyter笔记本中创建一个Sankey图表,我的代码基于 the first example shown here. 我最终得到了这个,我可以运行而不会出现任何错误: import numpy as npy import pandas as pd import plotly as ply ply.offline.init_notebook_mode(connected=True) df
-
交互式包plotly在R完全和ggplot2兼容,只需ggplotly(p+…),即使用自带的plotly函数也很方便,语法规则和ggplot2很相似,仿照help文件轻松搞定。