
PHPLOT 是一个用来创建图表的PHP图形类,需要 PHP5 的支持。PHPLot使用PHP的GD扩展来生成 PNG/GIF/JPEG 格式图片。
生成上面图形的代码如下:
# PHPlot Demo
# 2008-01-09 ljb
# For more information see http://sourceforge.net/projects/phplot/
# Load the PHPlot class library:
require_once 'phplot.php';
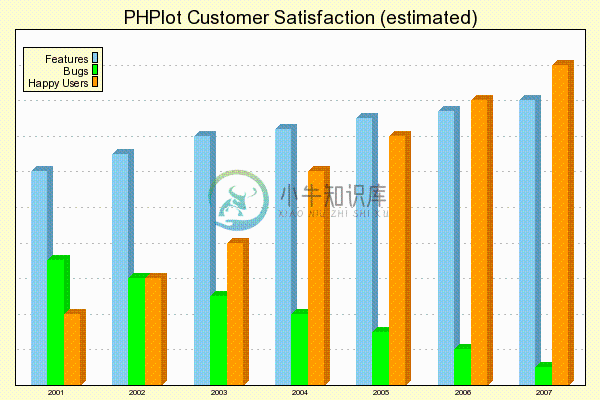
# Define the data array: Label, the 3 data sets.
# Year, Features, Bugs, Happy Users:
$data = array(
array('2001', 60, 35, 20),
array('2002', 65, 30, 30),
array('2003', 70, 25, 40),
array('2004', 72, 20, 60),
array('2005', 75, 15, 70),
array('2006', 77, 10, 80),
array('2007', 80, 5, 90),
);
# Create a PHPlot object which will make a 600x400 pixel image:
$p = new PHPlot(600, 400);
# Use TrueType fonts:
$p->SetDefaultTTFont('./arial.ttf');
# Set the main plot title:
$p->SetTitle('PHPlot Customer Satisfaction (estimated)');
# Select the data array representation and store the data:
$p->SetDataType('text-data');
$p->SetDataValues($data);
# Select the plot type - bar chart:
$p->SetPlotType('bars');
# Define the data range. PHPlot can do this automatically, but not as well.
$p->SetPlotAreaWorld(0, 0, 7, 100);
# Select an overall image background color and another color under the plot:
$p->SetBackgroundColor('#ffffcc');
$p->SetDrawPlotAreaBackground(True);
$p->SetPlotBgColor('#ffffff');
# Draw lines on all 4 sides of the plot:
$p->SetPlotBorderType('full');
# Set a 3 line legend, and position it in the upper left corner:
$p->SetLegend(array('Features', 'Bugs', 'Happy Users'));
$p->SetLegendWorld(0.1, 95);
# Turn data labels on, and all ticks and tick labels off:
$p->SetXDataLabelPos('plotdown');
$p->SetXTickPos('none');
$p->SetXTickLabelPos('none');
$p->SetYTickPos('none');
$p->SetYTickLabelPos('none');
# Generate and output the graph now:
$p->DrawGraph();
-
phplot是一个图表函数插件,最近在项目中使用到了,总结一下,欢迎交流。 PHPlot总结 1.导入tcpdf文件 require_once('phplot.php');2.实例化 $plot = new PHPlot(670, 400); 3.设置保存图片 $plot->SetIsInline(TRUE); $plot->SetOutputFile($picname); $plot->Se
-
我刚刚下载了PHPlot,并将其包含在php文件中.我试图得到一个示例工作,但是只有一些迹象而不是图表. 我正在使用XAMPP和Joomla. 这显示了我: 我需要启用GD,只是我的GD设置的屏幕截图: 我做错了吗? 我试图将文件放置在joomla之外,然后将其放置到xampp中-它可以工作.但我在joomla安装中需要该图. 码: header('Content-Type: image/png'
-
http://sourceforge.net/projects/phplot/ 原文出处:Netkiller 系列 手札 本文作者:陈景峯 转载请与作者联系,同时请务必标明文章原始出处和作者信息及本声明。
-
图表类型常量 填充数据 圆环图 面积图 直方图 条形图
-
图表工具 Cacoo [free to $] gliffy [free to $] draw.io [free to $]
-
Highcharts 支持多种图表类型,可以针对不同的数据都用合理的图表类型来展现。 Highcharts 目前支持直线图、曲线图、曲线面积图、面积图、面积范围图、柱状图、条形图、饼图、散点图、气泡图、仪表图等丰富的图表类型。 Highstock 支持和股票相关的图表类型,包括 K 线、分时图、蜡烛图等,另外 Highstock 支持大数据量时间轴图表。 Highmaps 支持和地理信息相关的地图
-
我看过很多关于如何在chart.js中添加数据的教程,但都是针对单个图表的。 我使用chartjs创建多个图表(每个图表都有自己的画布和唯一的ID)。例如:图表1位于id=“c1”的画布中,图表2位于id=“c2”的画布中。如何选择图表1并添加新数据?
-
我只想从JavaFX图表API生成一个图表图像。我不想显示应用程序窗口,也不想启动应用程序(如果没有必要)。 在start方法内部,我实际上需要访问外部数据以构建系列数据,但是似乎没有办法从start方法访问外部数据,如果我将数据存储在成员变量内部,则当开始叫做。我其实不在乎舞台和场景对象,只要图表图像可以渲染,我应该如何解决问题?我想建立一个可以用输入数据调用的API,用数据绘制图表,并返回文件
-
我是使用java的gxt新手。我有8个FramedPanel,我需要在下一个顺序中绘制,但我不知道如何绘制。 FramedPanels编号:
-
管理后台图表也是常见得需求。这里图表就只推荐 ECharts,功能齐全,社区 demo 也丰富 gallery。 我还是那个观点,大部分插件建议大家还是自己用 vue 来封装就好了,真的很简单。ECharts 支持 webpack 引入,图省事可以将 ECharts 整个引入 var echarts = require('echarts') 不过 ECharts 还是不小的,如果只使用它小部分功能
-
charts 图表