
GoAppMonitor —— Golang 应用性能数据监控。这是一个 Go 开发库,为你的 Go 应用程序提供监控功能。包含系统级别的监控和业务级别监控。
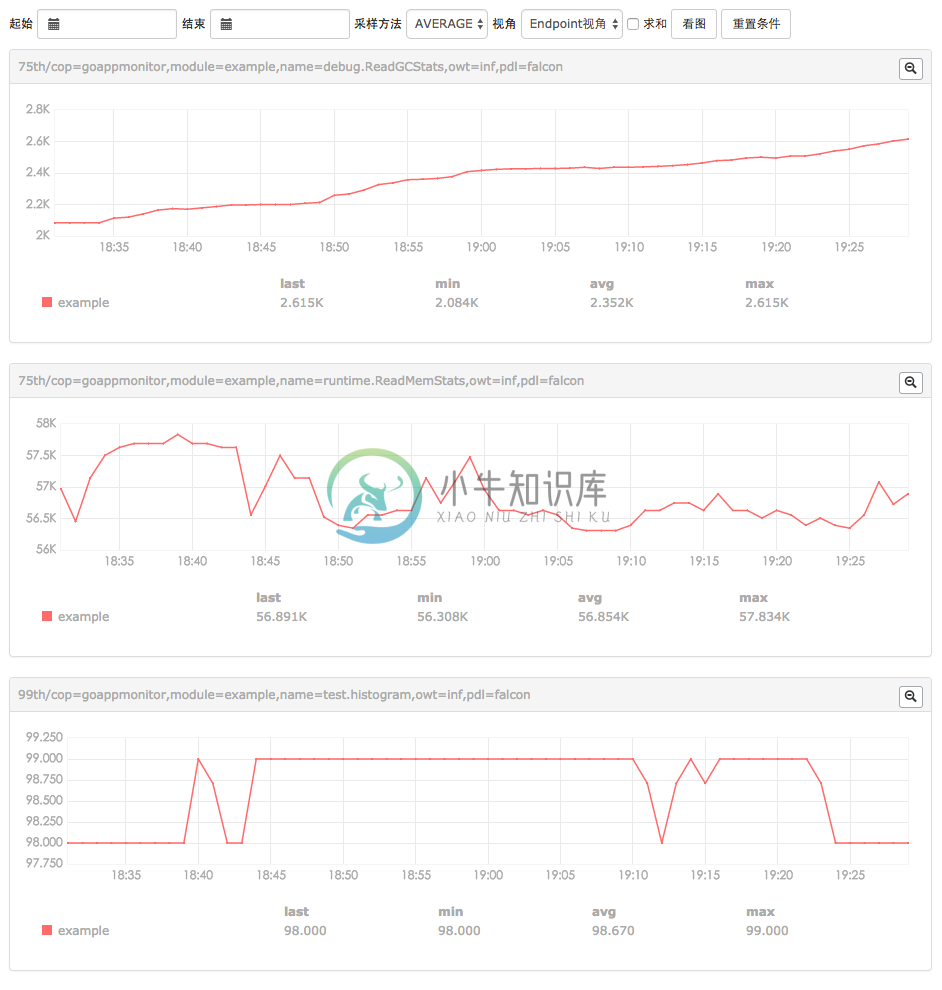
监控效果:
示例代码:
package main

import (
    "math/rand"
    "time"

    appm "github.com/wgliang/goappmonitor"
)

// Base or system performance data,such as memeory,gc,network and so on.
func baseOrsystem() {
    for _ = range time.Tick(time.Second * time.Duration(10)) {
        // (commonly used) Meter, used to sum and calculate the rate of change. Use scenarios
        // such as the number of home visits statistics, CG etc..
        pv := int64(rand.Int31n(100))
        appm.Meter("appm.meter", pv)
        appm.Meter("appm.meter.2", pv-50)

        // (commonly used) Gauge, used to preserve the value of the instantaneous value of the
        // type of record. Use scenarios such as statistical queue length, statistics CPU usage,
        // and so on.
        queueSize := int64(rand.Int31n(100) - 50)
        appm.Gauge("appm.gauge", queueSize)

        cpuUtil := float64(rand.Int31n(10000)) / float64(100)
        appm.GaugeFloat64("appm.gauge.float64", cpuUtil)
    }
}

// Custom or business performance data,such as qps,num of function be called, task queue and so on.
func customOrbusiness() {
    for _ = range time.Tick(time.Second) {
        // Histogram, using the exponential decay sampling method, the probability distribution of
        // the statistical object is calculated. Using scenarios such as the probability distribution
        // of the statistics home page to access the delay
        delay := int64(rand.Int31n(100))
        appm.Histogram("appm.histogram", delay)
    }
}

func main() {
    var ch chan int
    go baseOrsystem()
    go customOrbusiness()
    <-ch
}-
背景 APM 是应用性能监控的缩写。目前 APM 的主要功能着眼于分布式系统的性能诊断,其主要功能包括调用链展示,应用拓扑分析等。 Apache ShardingSphere 并不负责如何采集、存储以及展示应用性能监控的相关数据,而是将 SQL 解析与 SQL 执行这两块数据分片的最核心的相关信息发送至应用性能监控系统,并交由其处理。 换句话说,Apache ShardingSphere 仅负责产
-
SkyWalking 是 Seata 组件中重要的APM(应用性能监控)实现. 预备工作 当您将 SkyWalking 整合到您的 Seata 工程前,请确保后台已经启动 SkyWalking 服务,如果您尚且不熟悉 SkyWalking 的基本使用的话,可先行参考 SkyWalking 快速入门。建议使用 SkyWalking 8.4.0 及以上的版本。 快速上手 Seata 融合 SkyWal
-
"性能监控"整合了Threejs的监控组件stats,如果你对这个组件感兴趣,你可以从它的 github 仓库中了解更多细节。如果你想要在gio场景中显示这个组件,你可以使用 enableStats() API,这个性能监控面板默认会显示在左上角。
-
目录 性能监控 监控CPU 查询内存 查询页面交换 查询硬盘使用 综合应用 总结 附录 在使用操作系统的过程中,我们经常需要查看当前的性能如何,需要了解CPU、内存和硬盘的使用情况;本节介绍的这几个工具能满足日常工作要求; 6.1. 监控CPU 查看CPU使用率 - sar -u eg: - sar -u 1 2 [/home/weber#]sar -u 1 2 Linux 2.6.35-22
-
Ganglia监控Apache Haoop集群部署文档&参数表一览(最全面)
-
显示或隐藏左上角的 性能监控 组件。在使用这个API之前,需要先在HTML页面的 <header> 部分引入stats.min.js <header> <script src="stats.min.js"></script> </header> controller.enableStats(); controller.disableStats();
-
本文向大家介绍MongoDB性能优化及监控,包括了MongoDB性能优化及监控的使用技巧和注意事项,需要的朋友参考一下 MongoDB 是一个基于分布式文件存储的数据库。由 C++ 语言编写。旨在为 WEB 应用提供可扩展的高性能数据存储解决方案。 MongoDB 是一个介于关系数据库和非关系数据库之间的产品,是非关系数据库当中功能最丰富,最像关系数据库的。 一、索引 MongoDB 提供了多样性