Making Elegant Matlab Figures
A repository comprising multiple functions for making elegant publication-quality figures in MATLAB.
Table of Contents
- Boxplot (
figure_boxplot.m) - GeneratePDF (
generatePDF.m) - Heatmap (
figure_heatmap.m) - Violinplot
- Citation
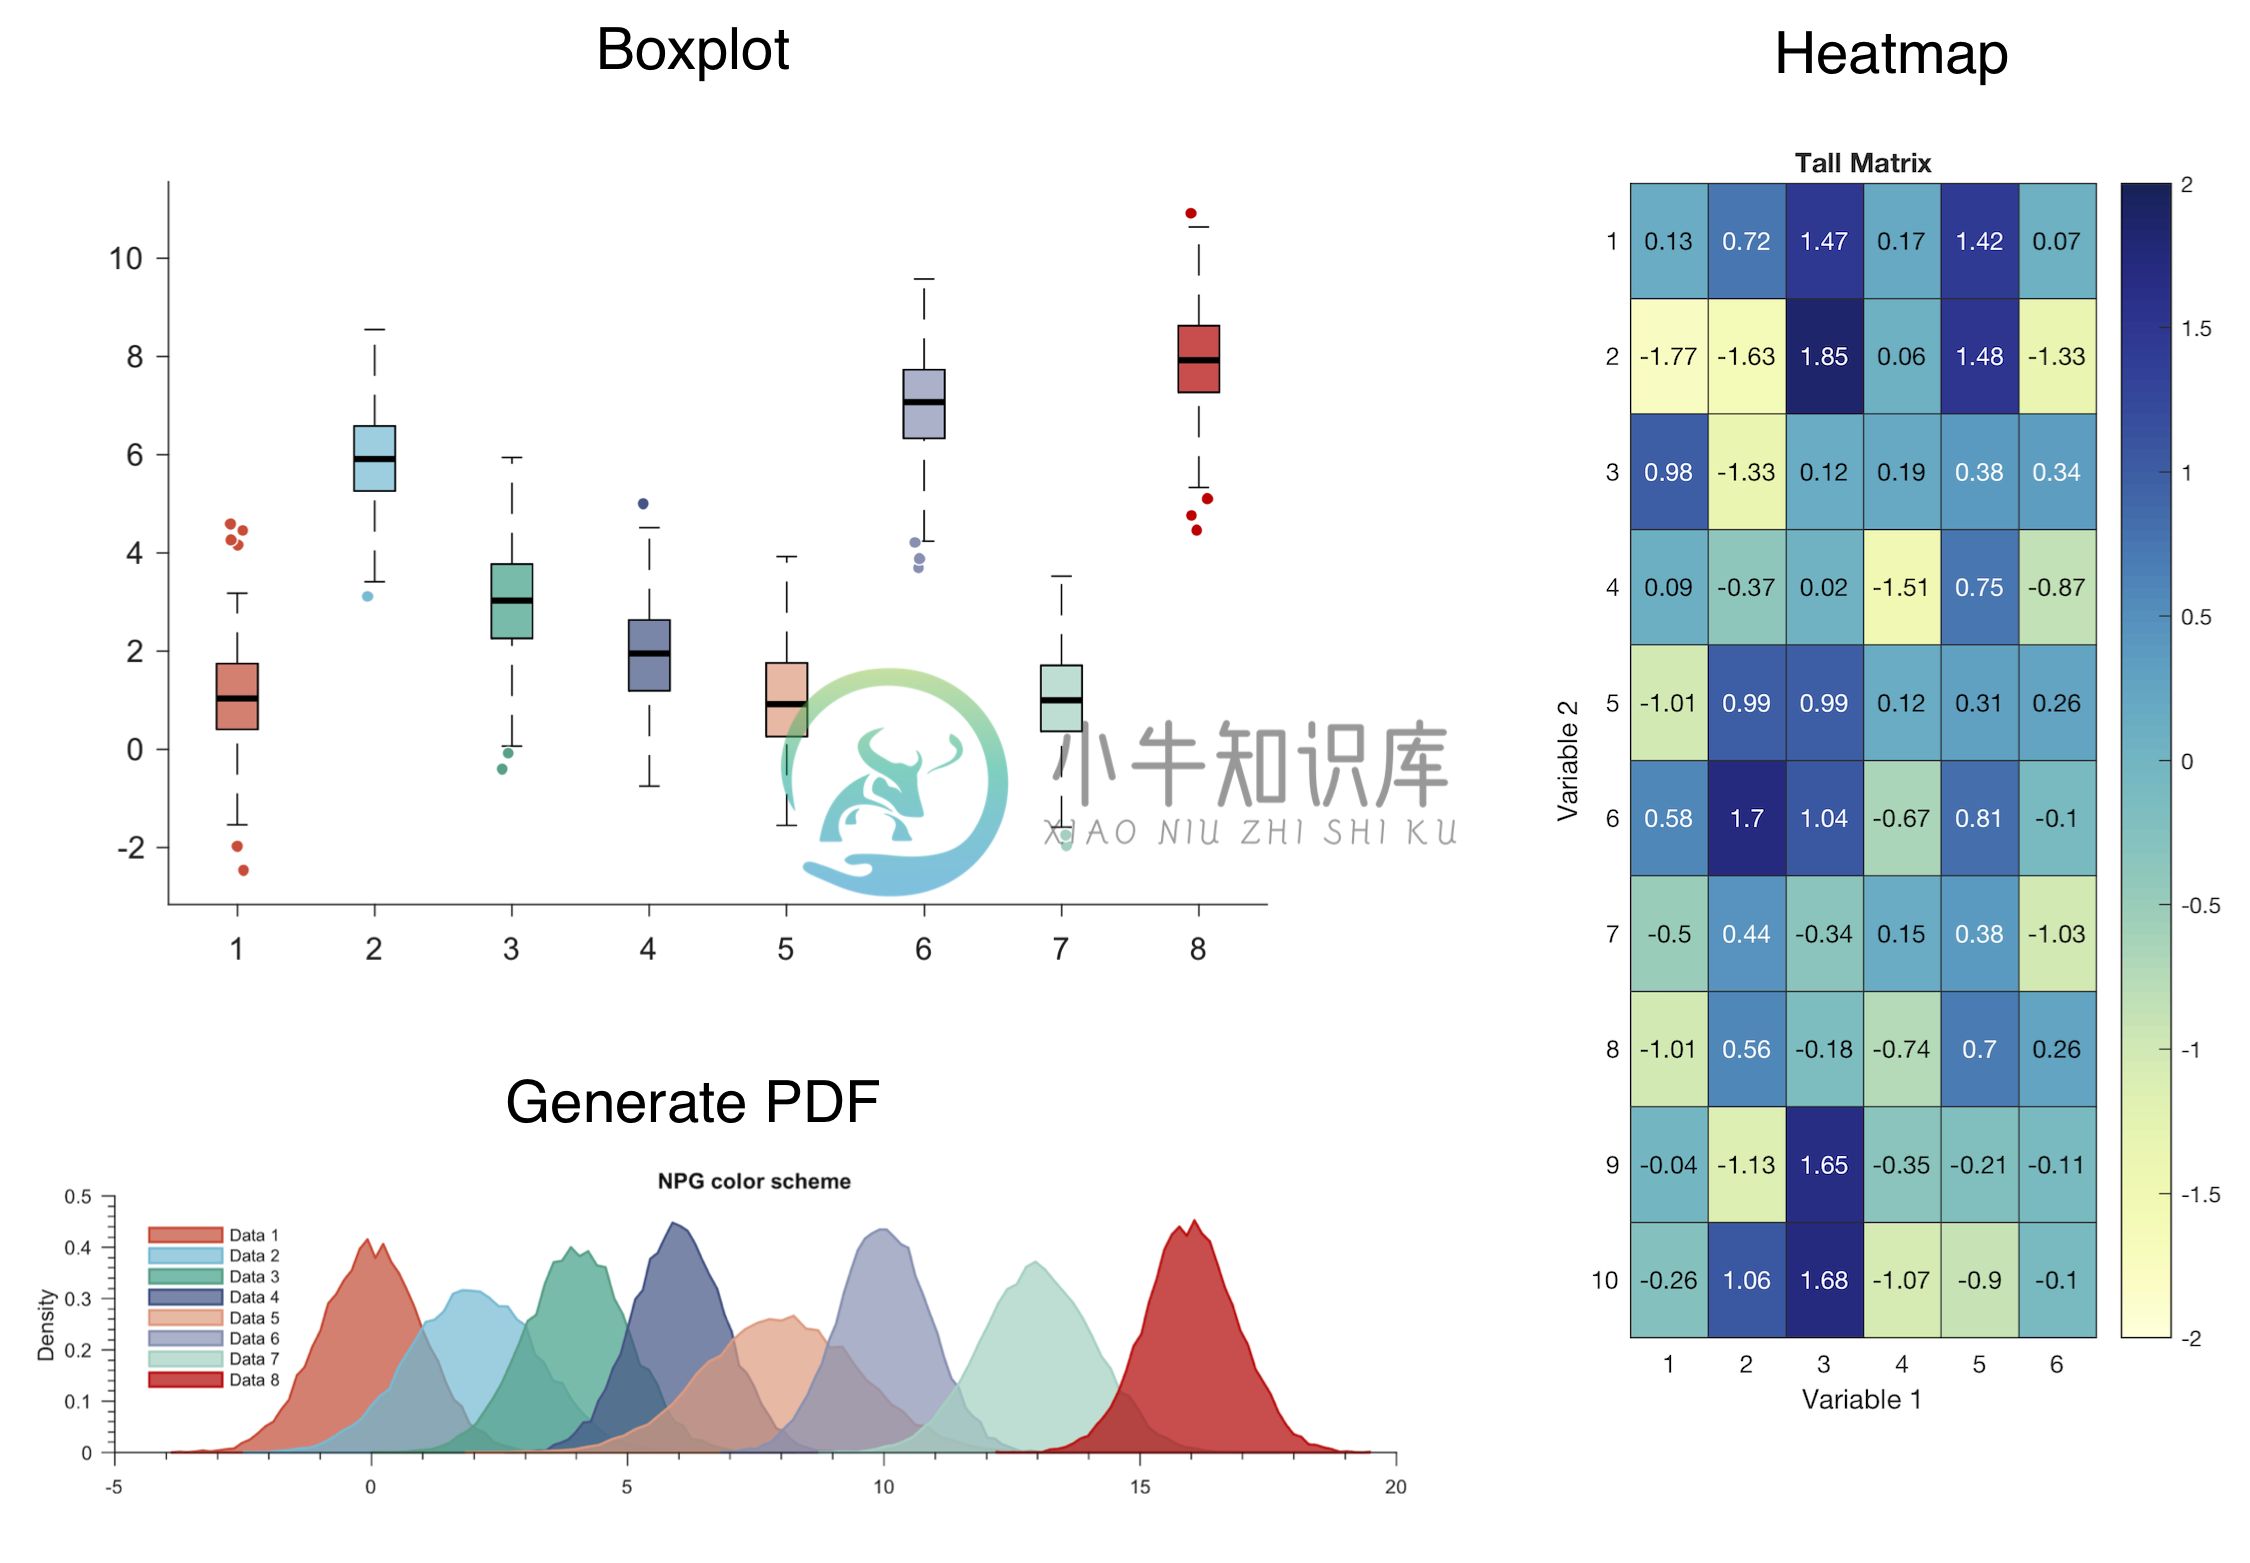
Boxplot
Generating boxplot in MATLAB using the default function boxplot.m is a bit cumbersome due to the large number of required (and somewhat strict in terms of format) inputs. Here, I have written a wrapper code for making nice boxplots quickly and efficiently.
Function: figure_boxplot.m
Example 1: Boxplot using only data input and no other specification
% Number of intended boxes in the figure
num_boxes = 8;

% Generating random data
data = cell(1,num_boxes);
for k = 1:num_boxes
    data{k} = randi(10) + randn(1,1000);
end

% Using the "figure_boxplot.m" function to plot the boxplot figure using the data

figure_boxplot(data)
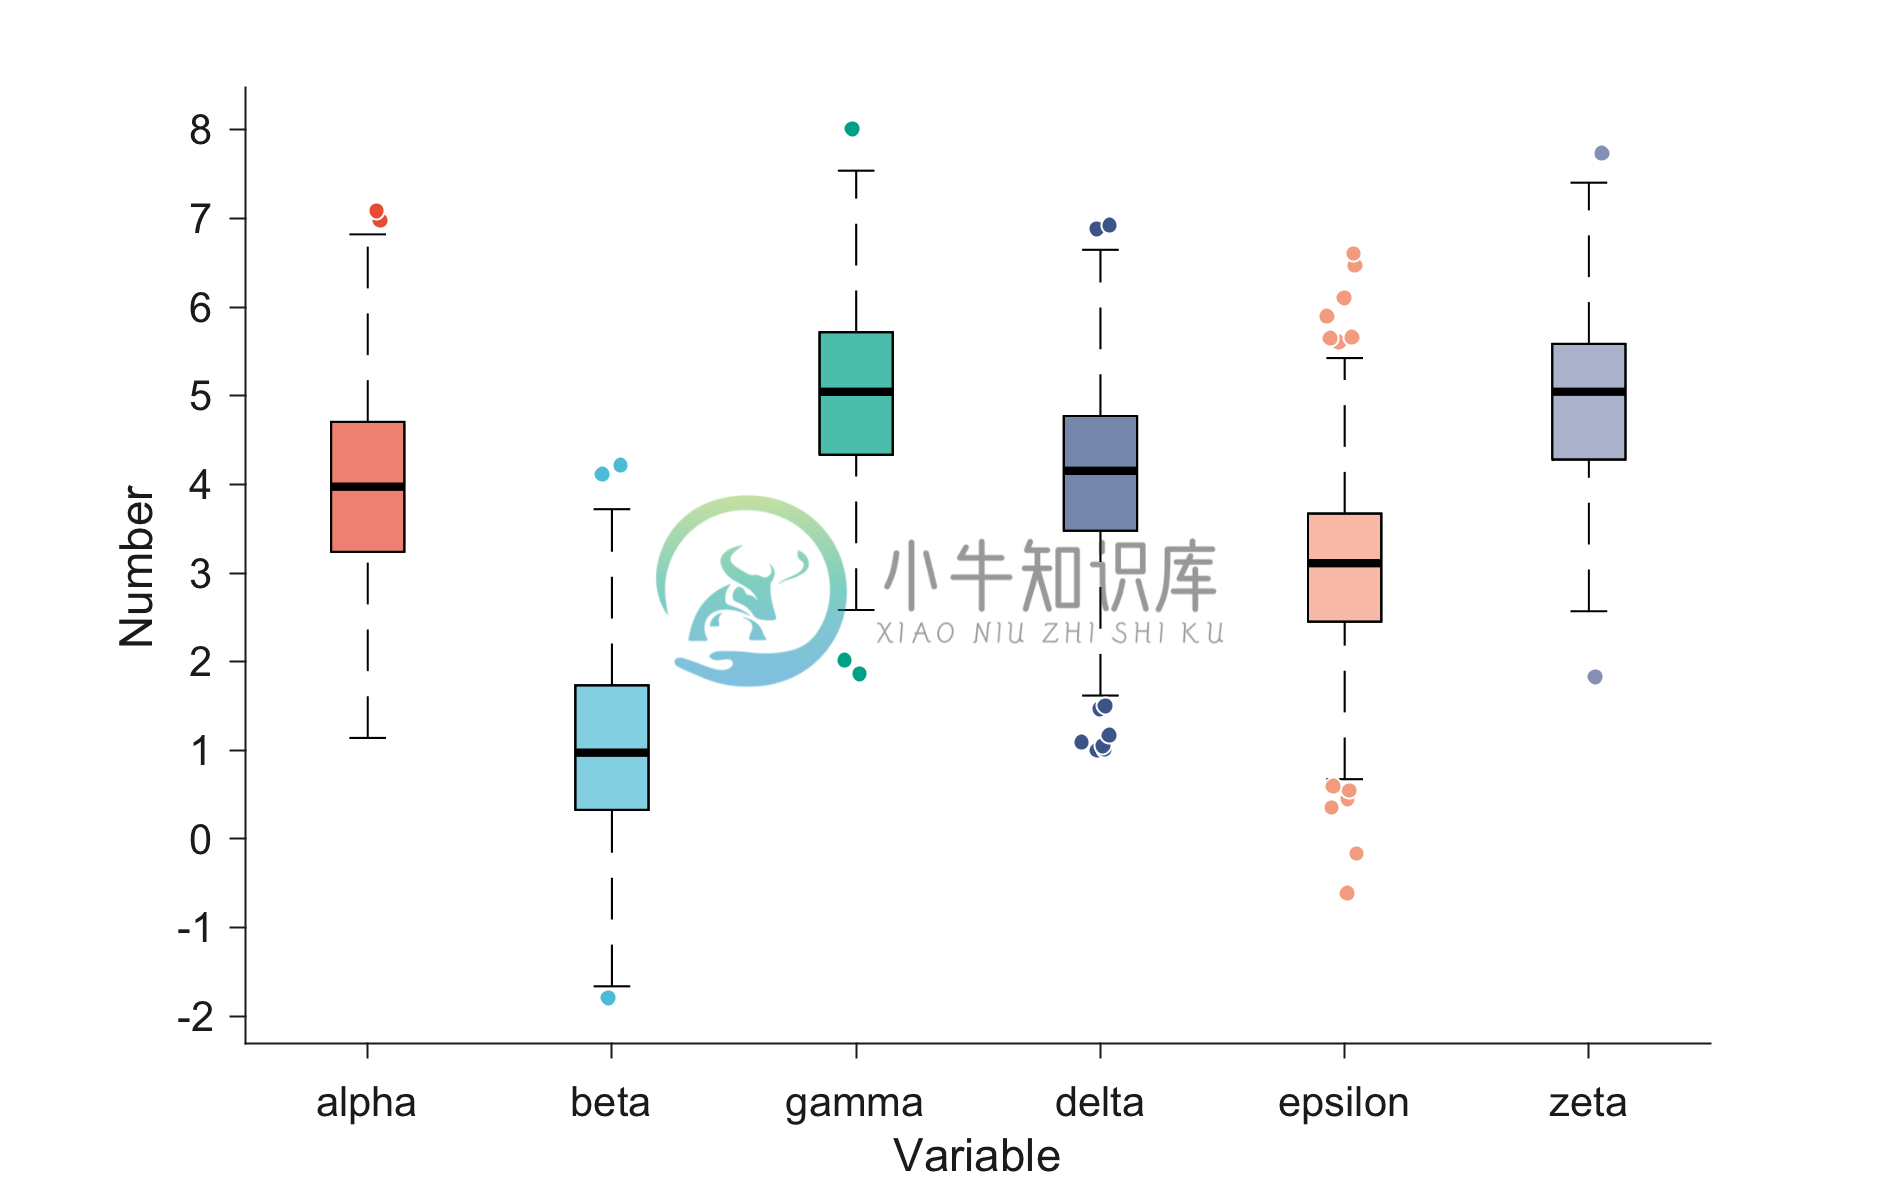
Example 2: Boxplot using minimum input specifications
% Number of intended boxes in the figure
num_boxes = 6;

% Generating random data
data = cell(1,num_boxes);
for k = 1:num_boxes
    data{k} = randi(10) + randn(1,1000);
end

% Using the "figure_boxplot.m" function to plot the boxplot figure using the data,
% x- and y-axis labels, and label of each box.
% For more information related to function inputs, check the function "figure_boxplot.m"

label_axes = {'Variable','Number'};
label_boxes = {'alpha','beta','gamma','delta','epsilon','zeta'};
figure_boxplot(data,label_axes,label_boxes);
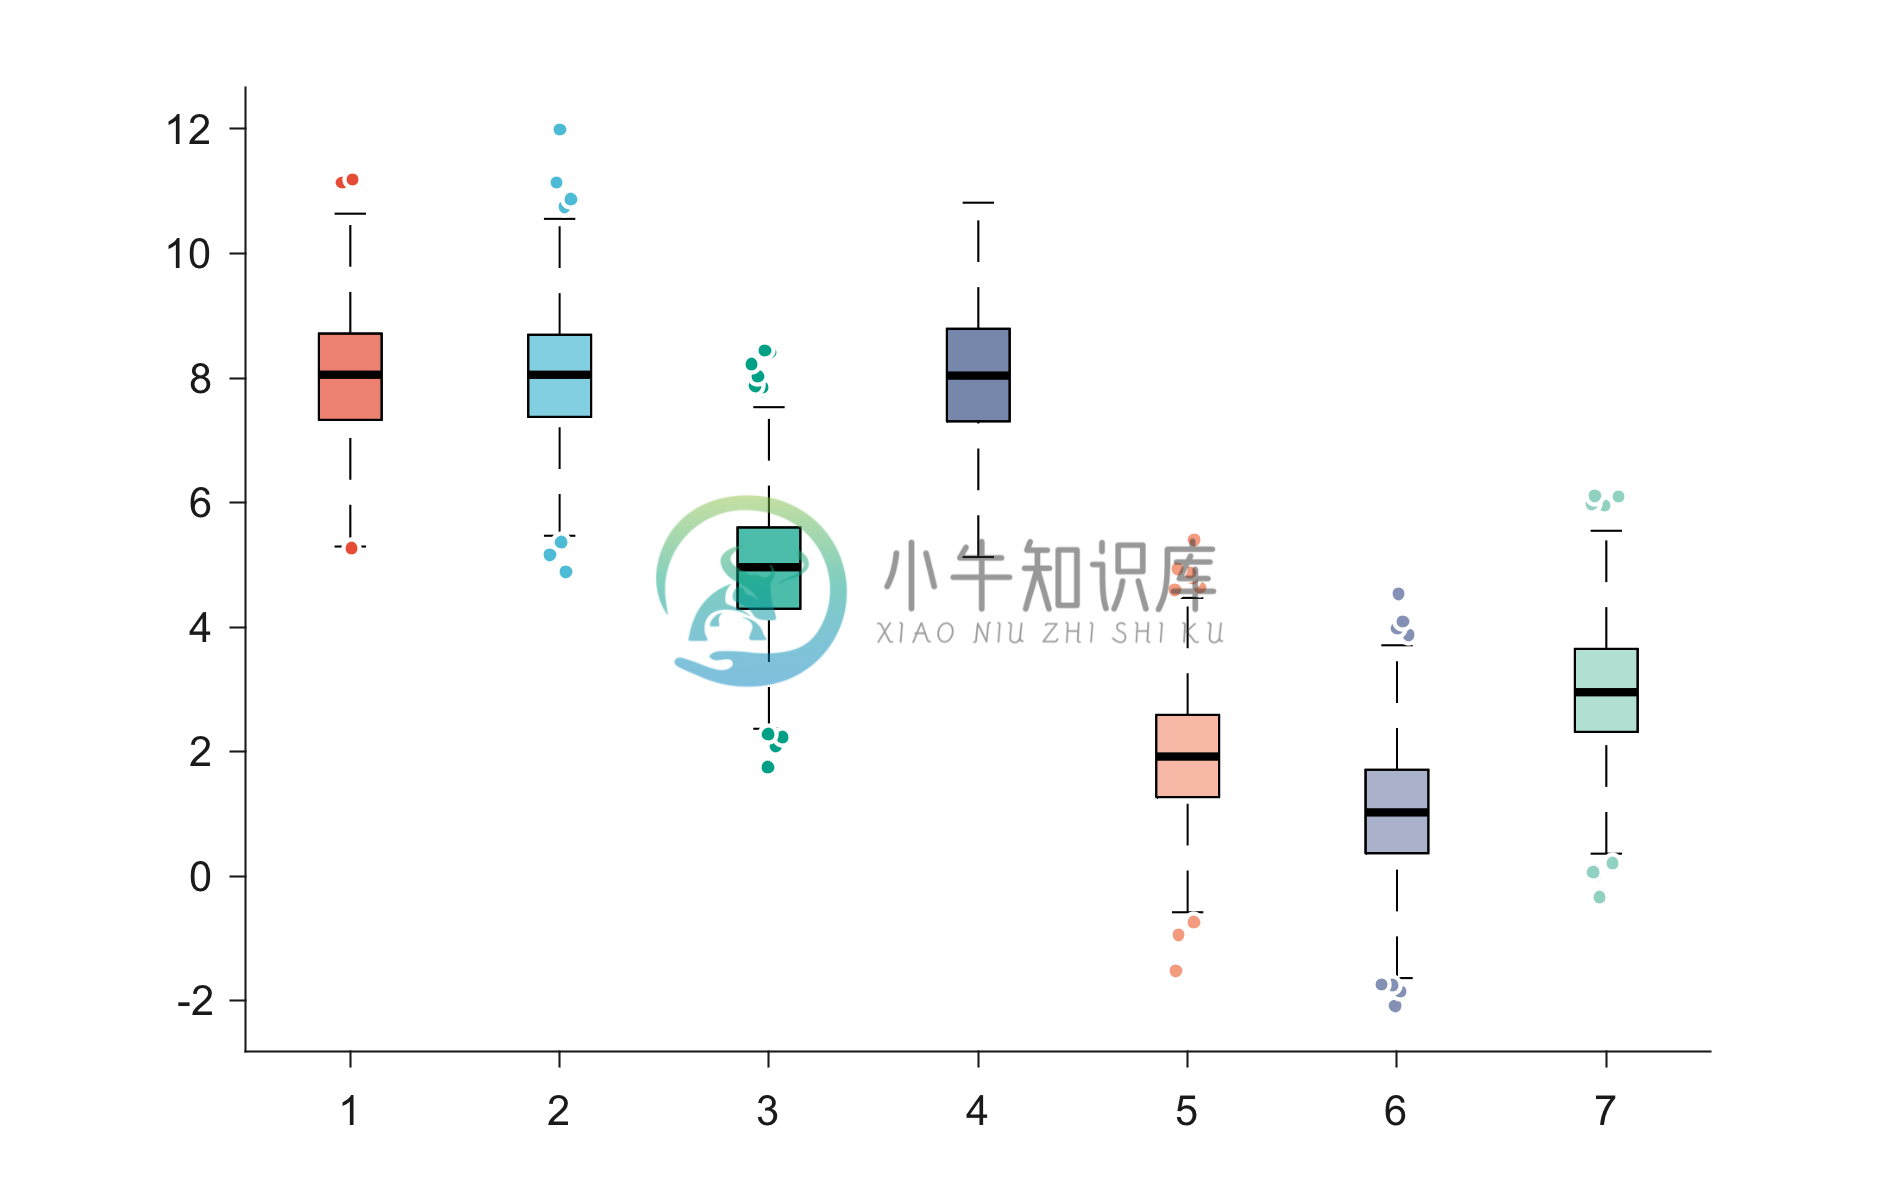
Example 3: Boxplot using data input in matrix format
Instead of a cell, the code works even if the input is in matrix form of size num_samples x num_boxes.
% Number of intended boxes in the figure
num_boxes = 7;
% Number of samples in each box plot
num_samples = 1000;

% Generating random data
data = zeros(num_samples,num_boxes);
for k = 1:num_boxes
    data(:,k) = randi(10) + randn(num_samples,1);
end

% Using the "figure_boxplot.m" function to plot the boxplot figure using the data

figure_boxplot(data)
GeneratePDF
This is a code to generate nice (properly normalized) probability density function (PDF) plots with minimum amount of input arguments.
Function: generatePDF.m
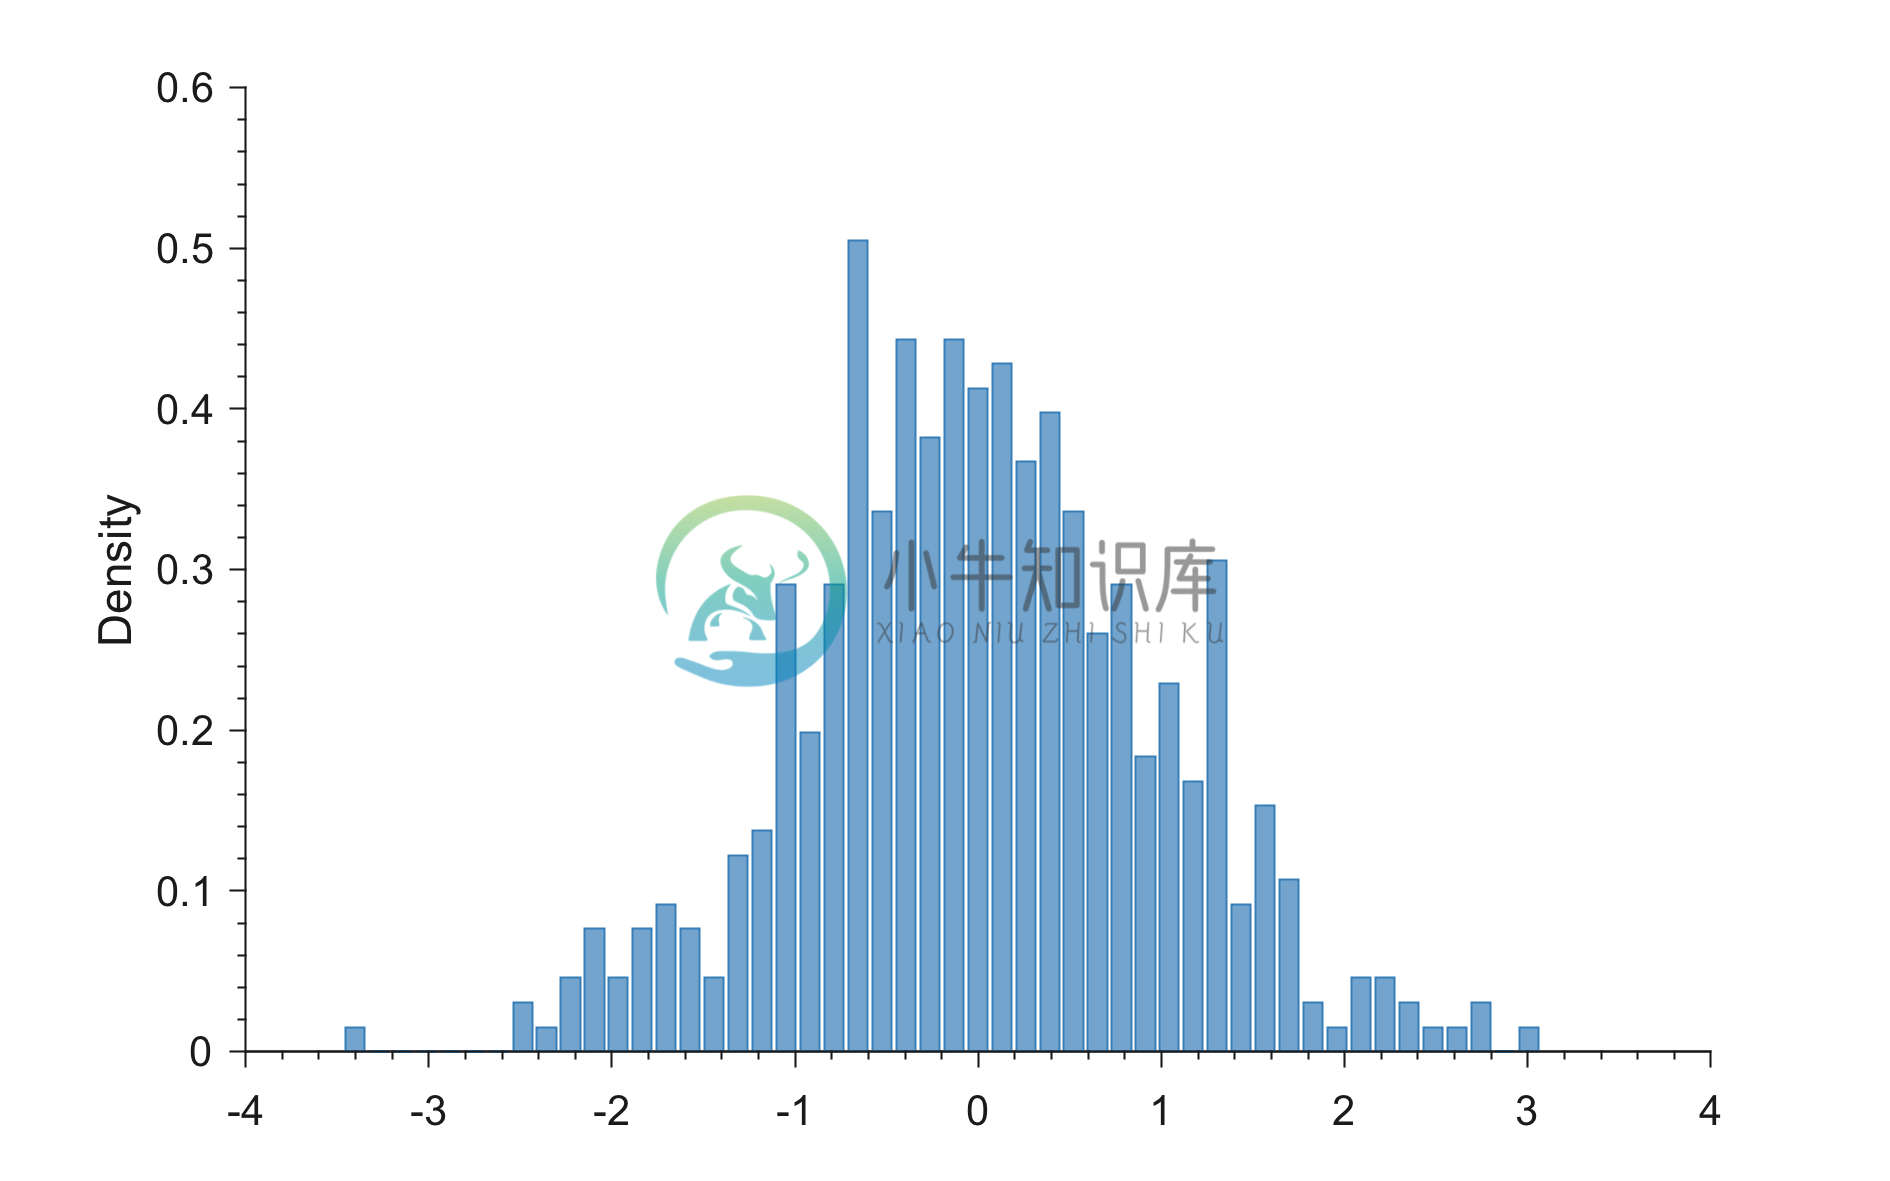
Example 1: Generating PDF with only data input
% Generating random data
x = randn(1,500);

figure;
generatePDF(x)
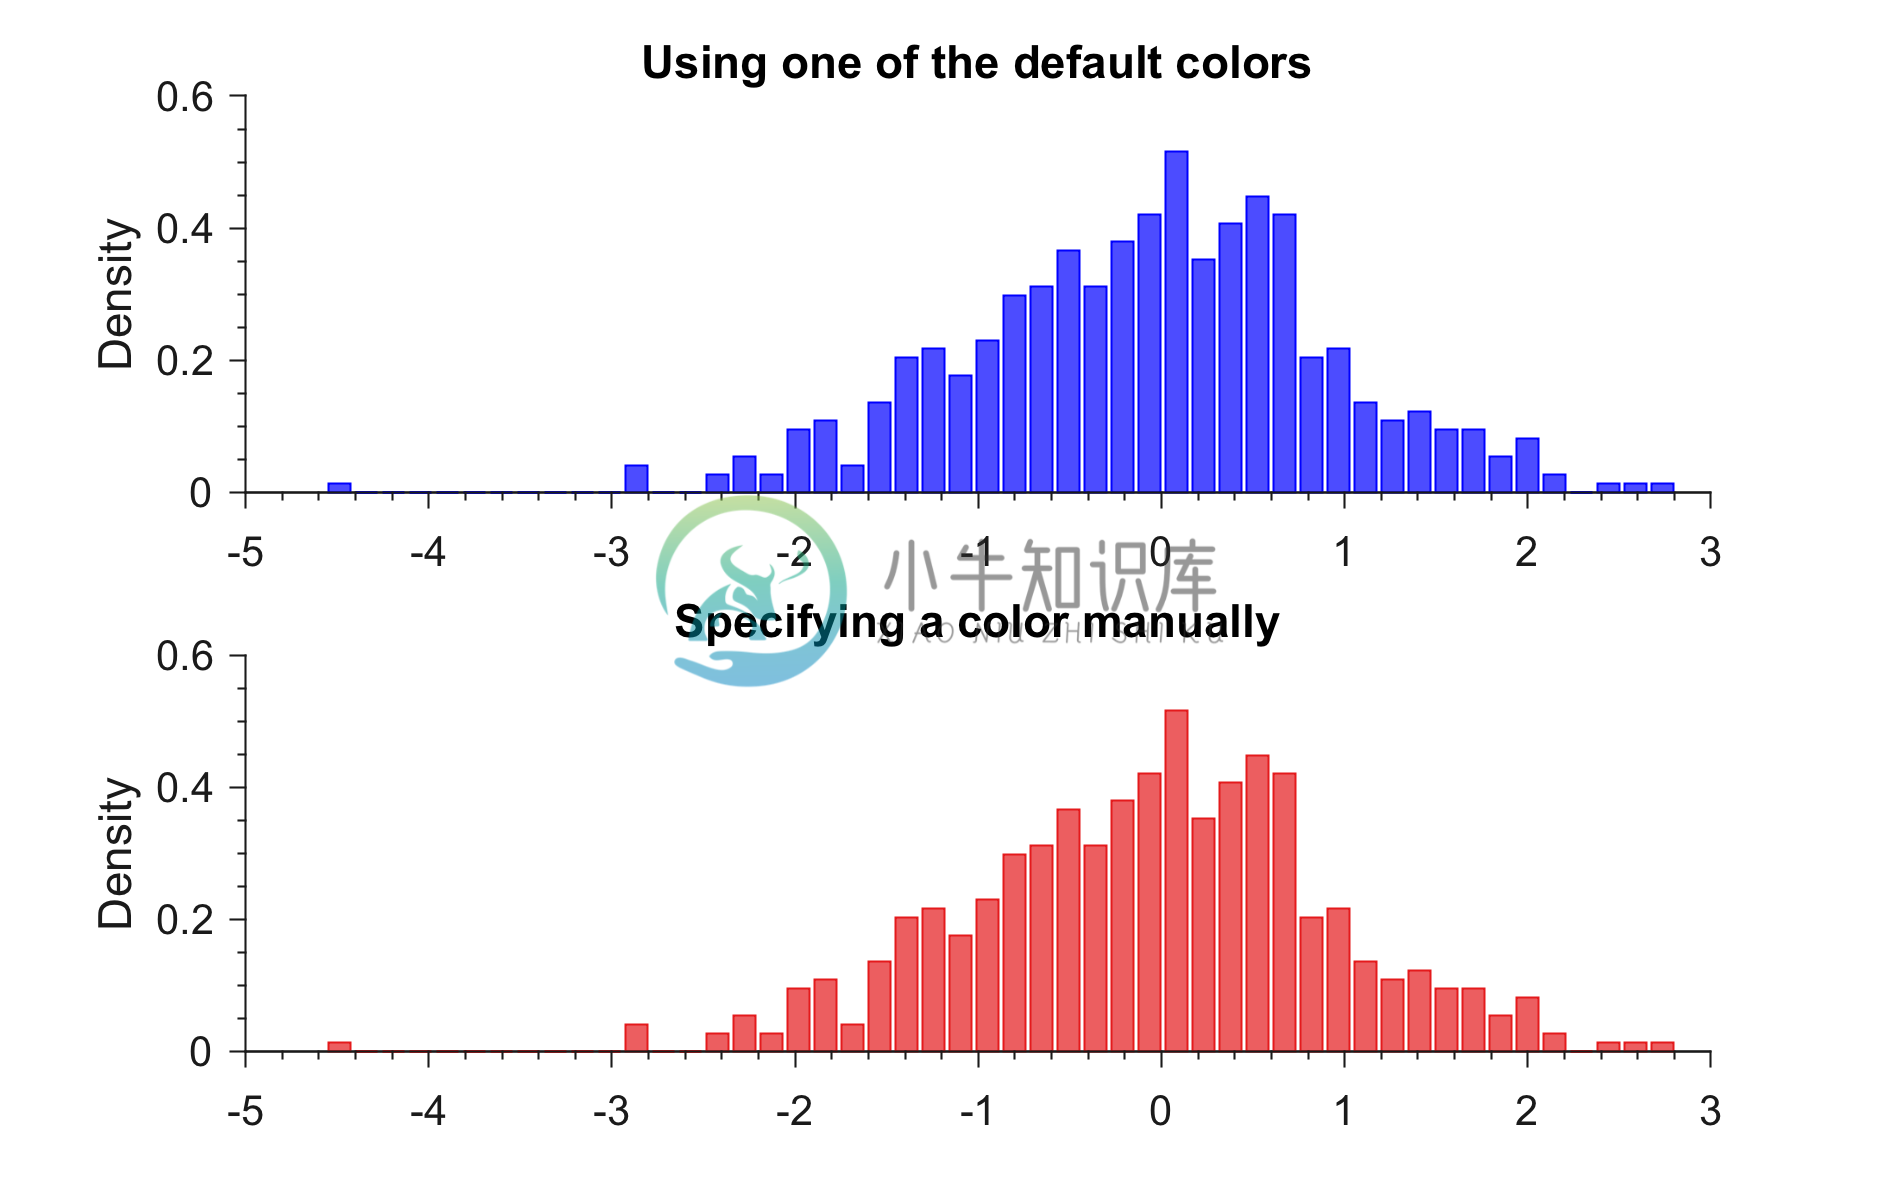
Example 2: Generating PDF in a specified color
% Loading colors
run colors_definitions.m

% Generating random data
x = randn(1,500);

figure;
subplot(2,1,1)
generatePDF(x,'b') %You can use any color
title('Using one of the default colors')
subplot(2,1,2)
generatePDF(x,color_scheme_set1(1,:)) %You can use any color
title('Specifying a color manually')
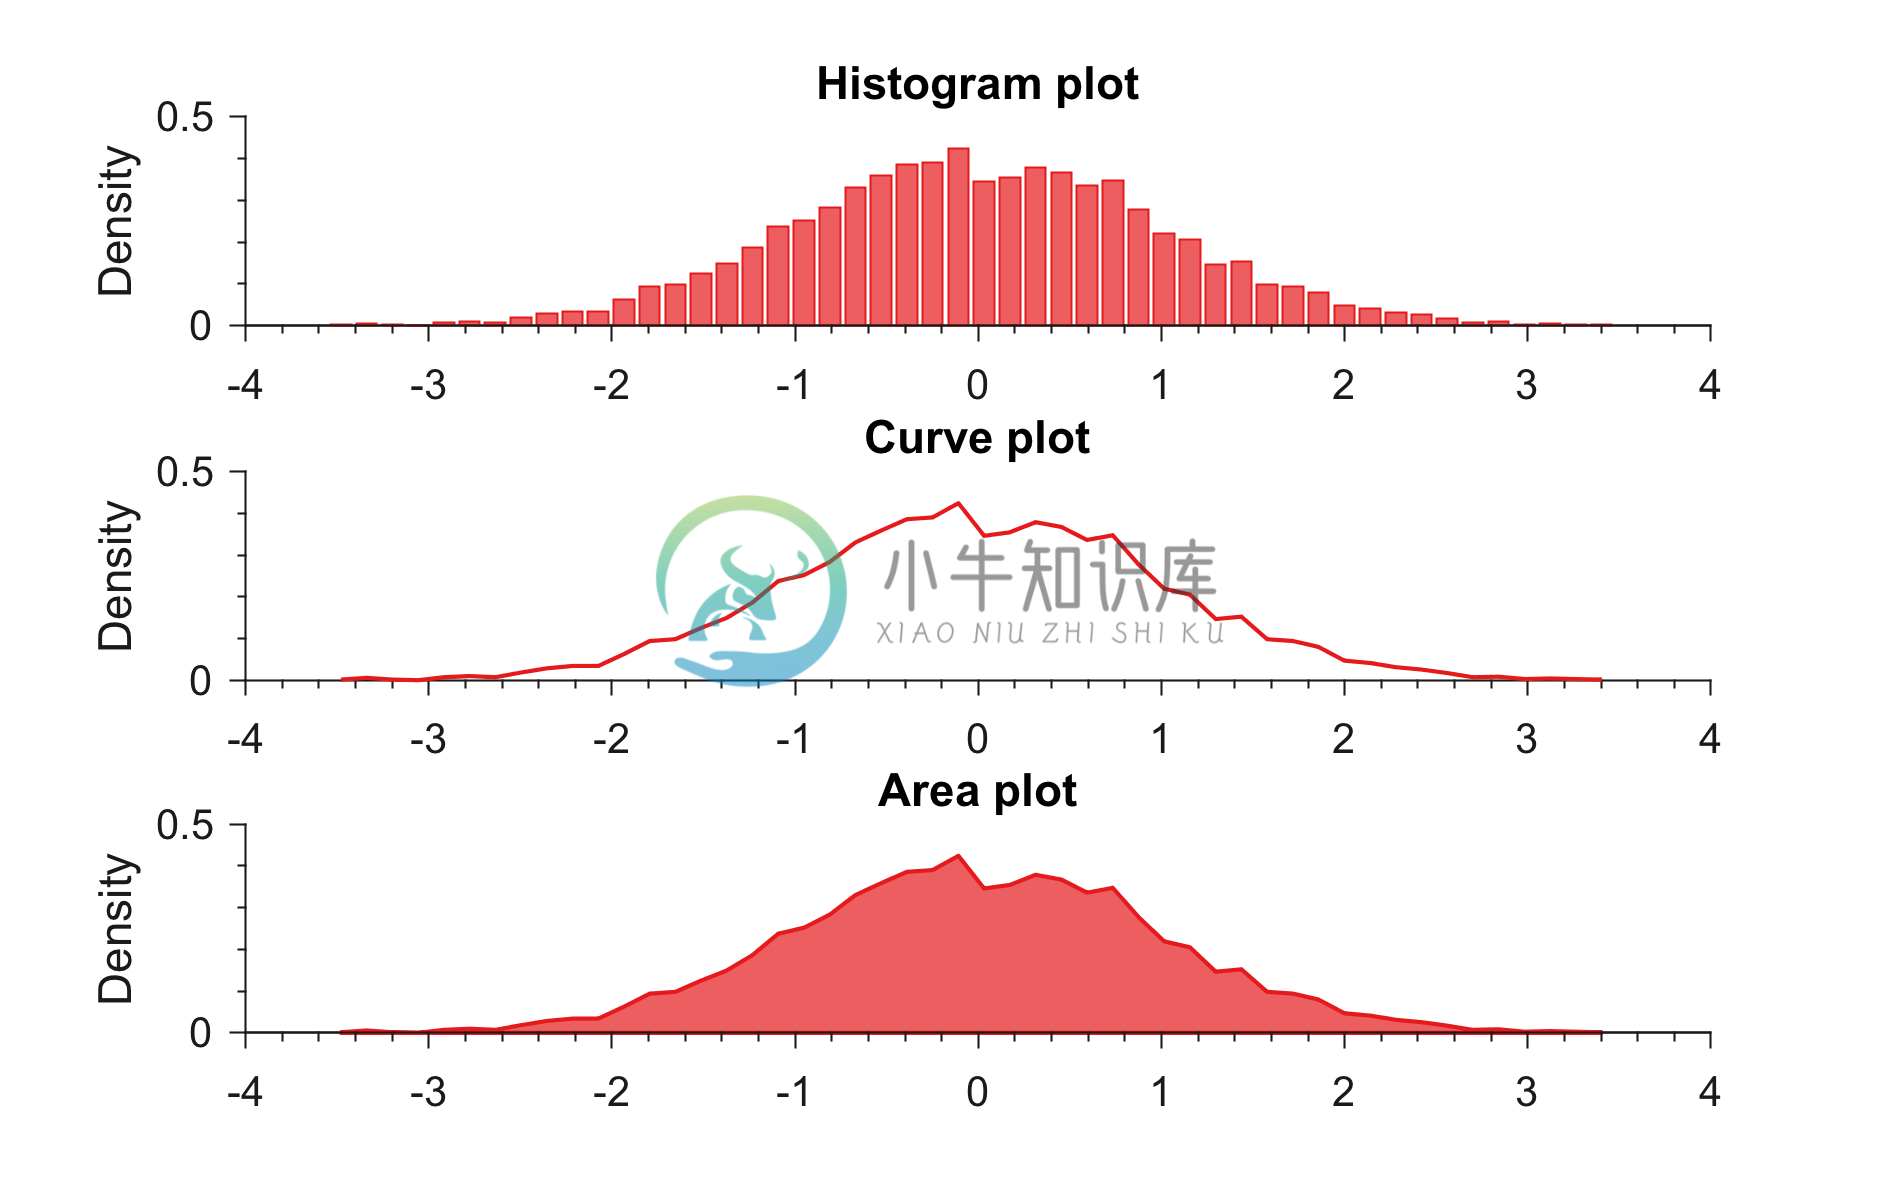
Example 3: Generating PDFs in different styles
% Loading colors
run colors_definitions.m

% Generating random data
x = randn(1,5000);

figure;
subplot(3,1,1)
generatePDF(x,color_scheme_set1(1,:),'hist')
title('Histogram plot')
subplot(3,1,2)
generatePDF(x,color_scheme_set1(1,:),'curve')
title('Curve plot')
subplot(3,1,3)
generatePDF(x,color_scheme_set1(1,:),'area')
title('Area plot')
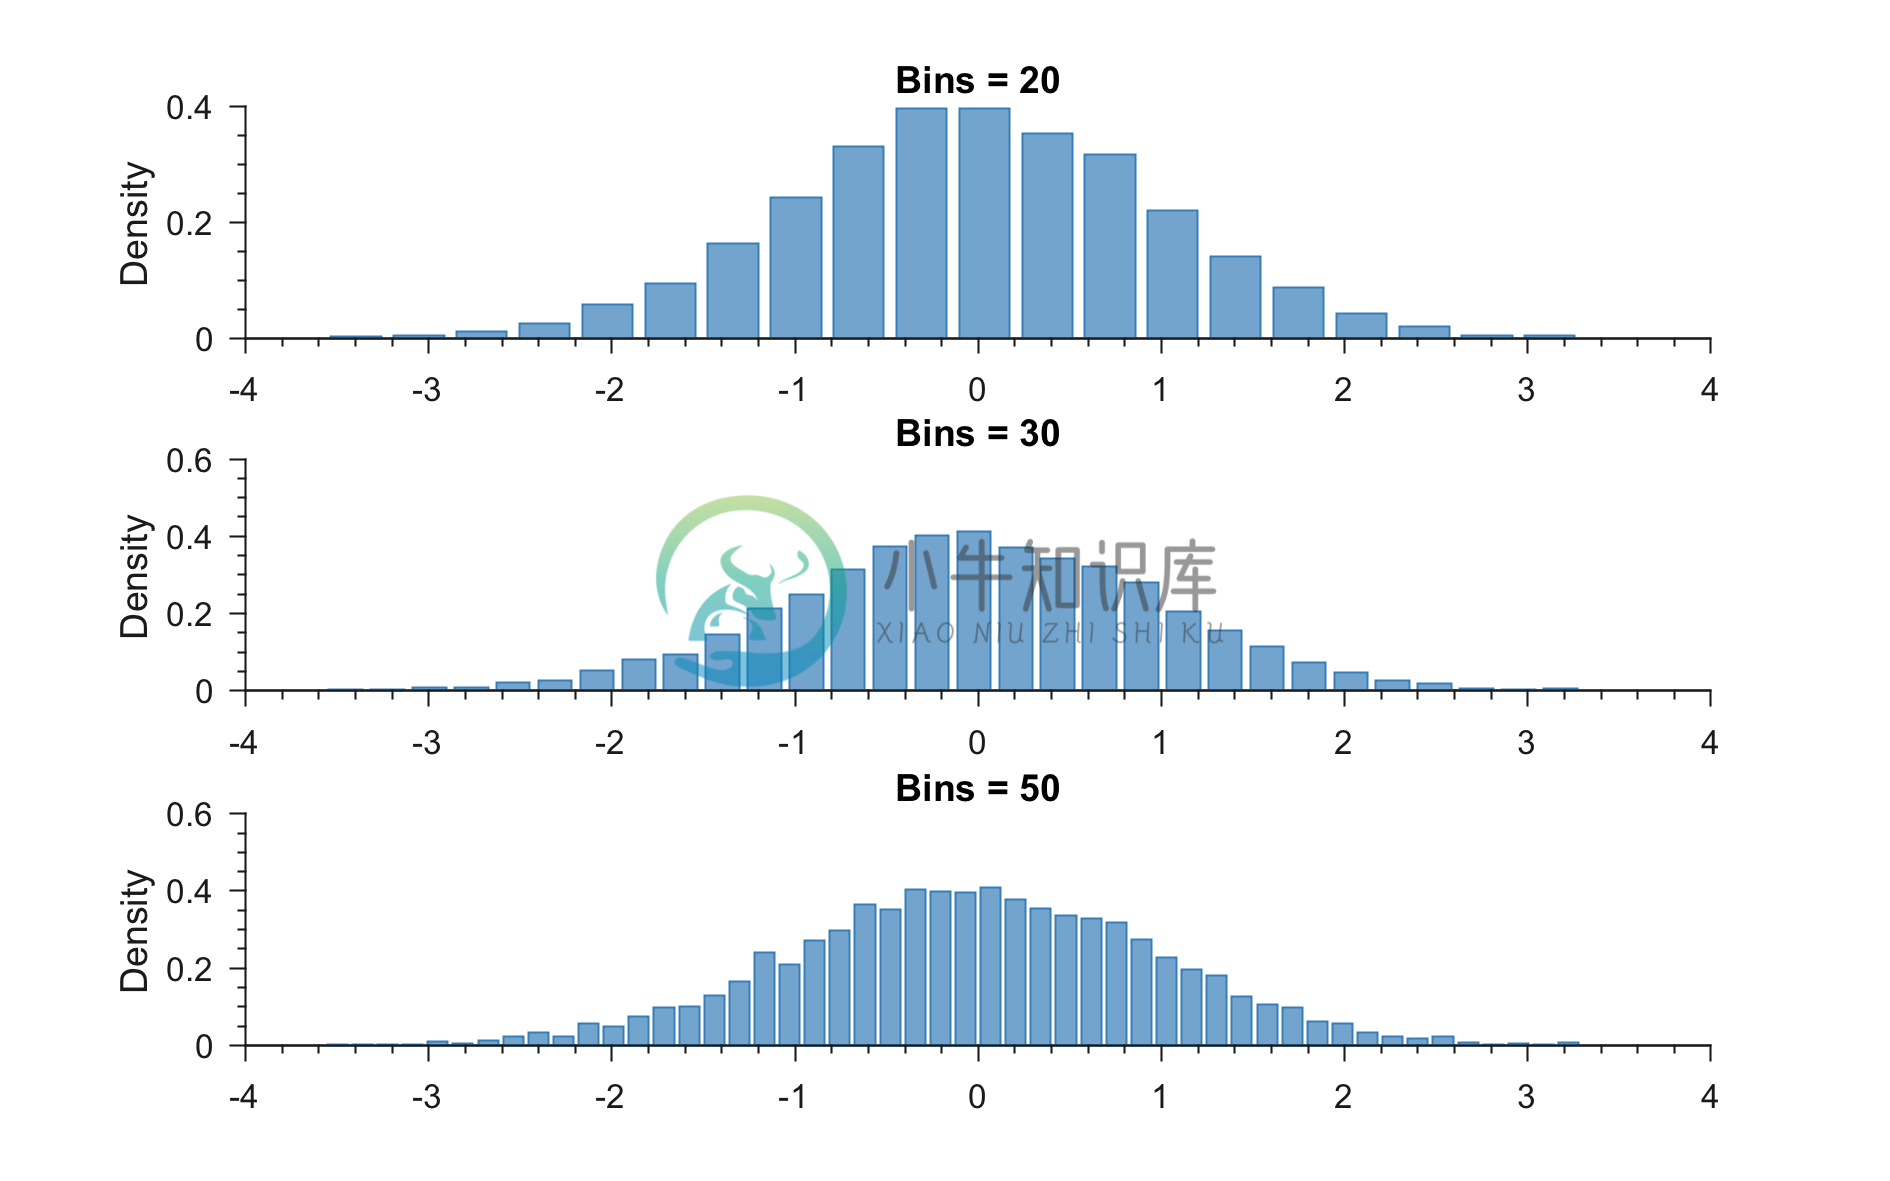
Example 4: Generating PDFs with specific number of bins
% Loading colors
run colors_definitions.m

% Generating random data
x = randn(1,5000);

% Specifying the number of bins
no_of_bins = [20 30 50];

figure;
for k = 1:3
    subplot(3,1,k)
    generatePDF(x,color_scheme_set1(2,:),'hist',no_of_bins(k))
    title(sprintf('Bins = %d',no_of_bins(k)))
end
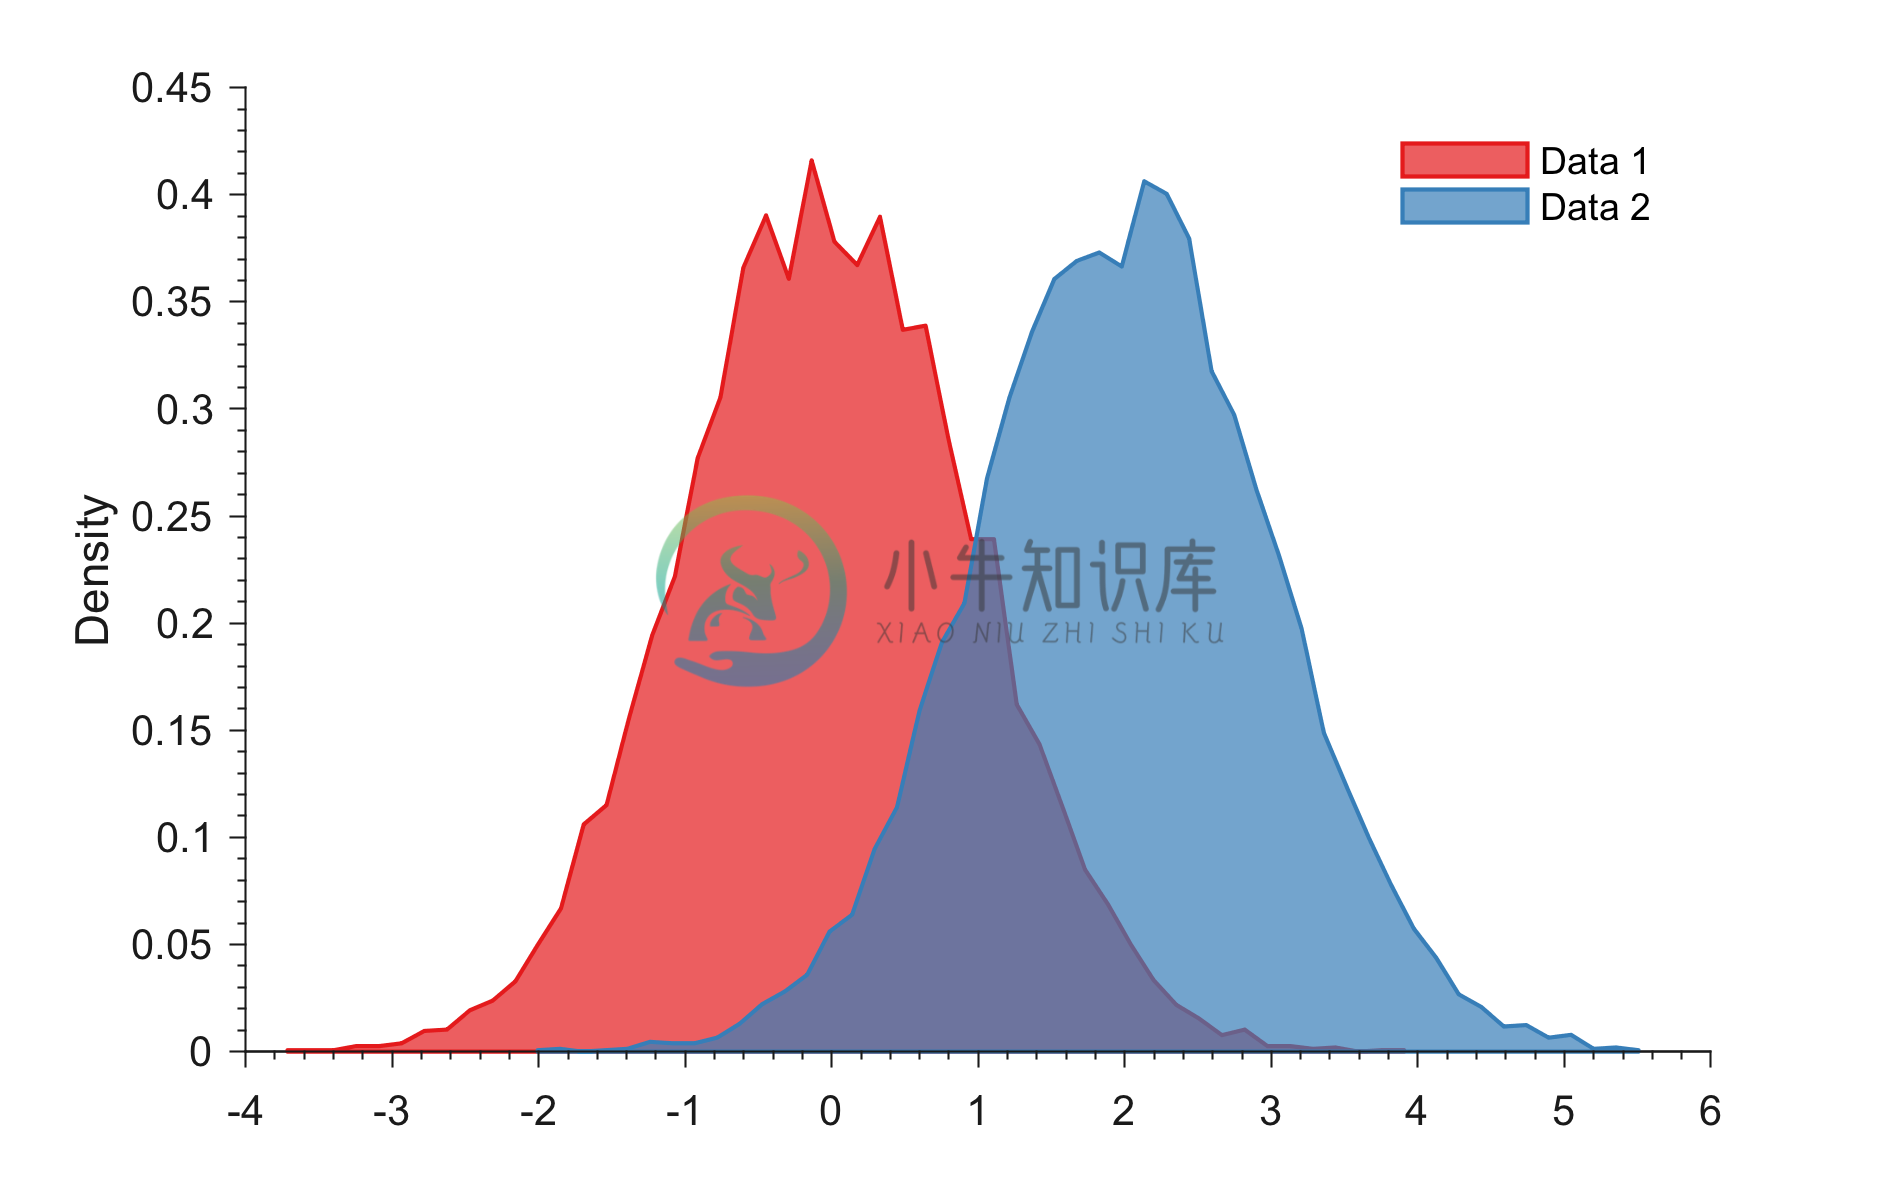
Example 5: Generating overlapping PDFs
% Loading colors
run colors_definitions.m

% Generating random data
x = randn(1,1e4);
y = 2 + randn(1,1e4);

figure;
generatePDF(x,color_scheme_set1(1,:),'area')
hold on
generatePDF(y,color_scheme_set1(2,:),'area')
legend('Data 1','Data 2'); legend boxoff
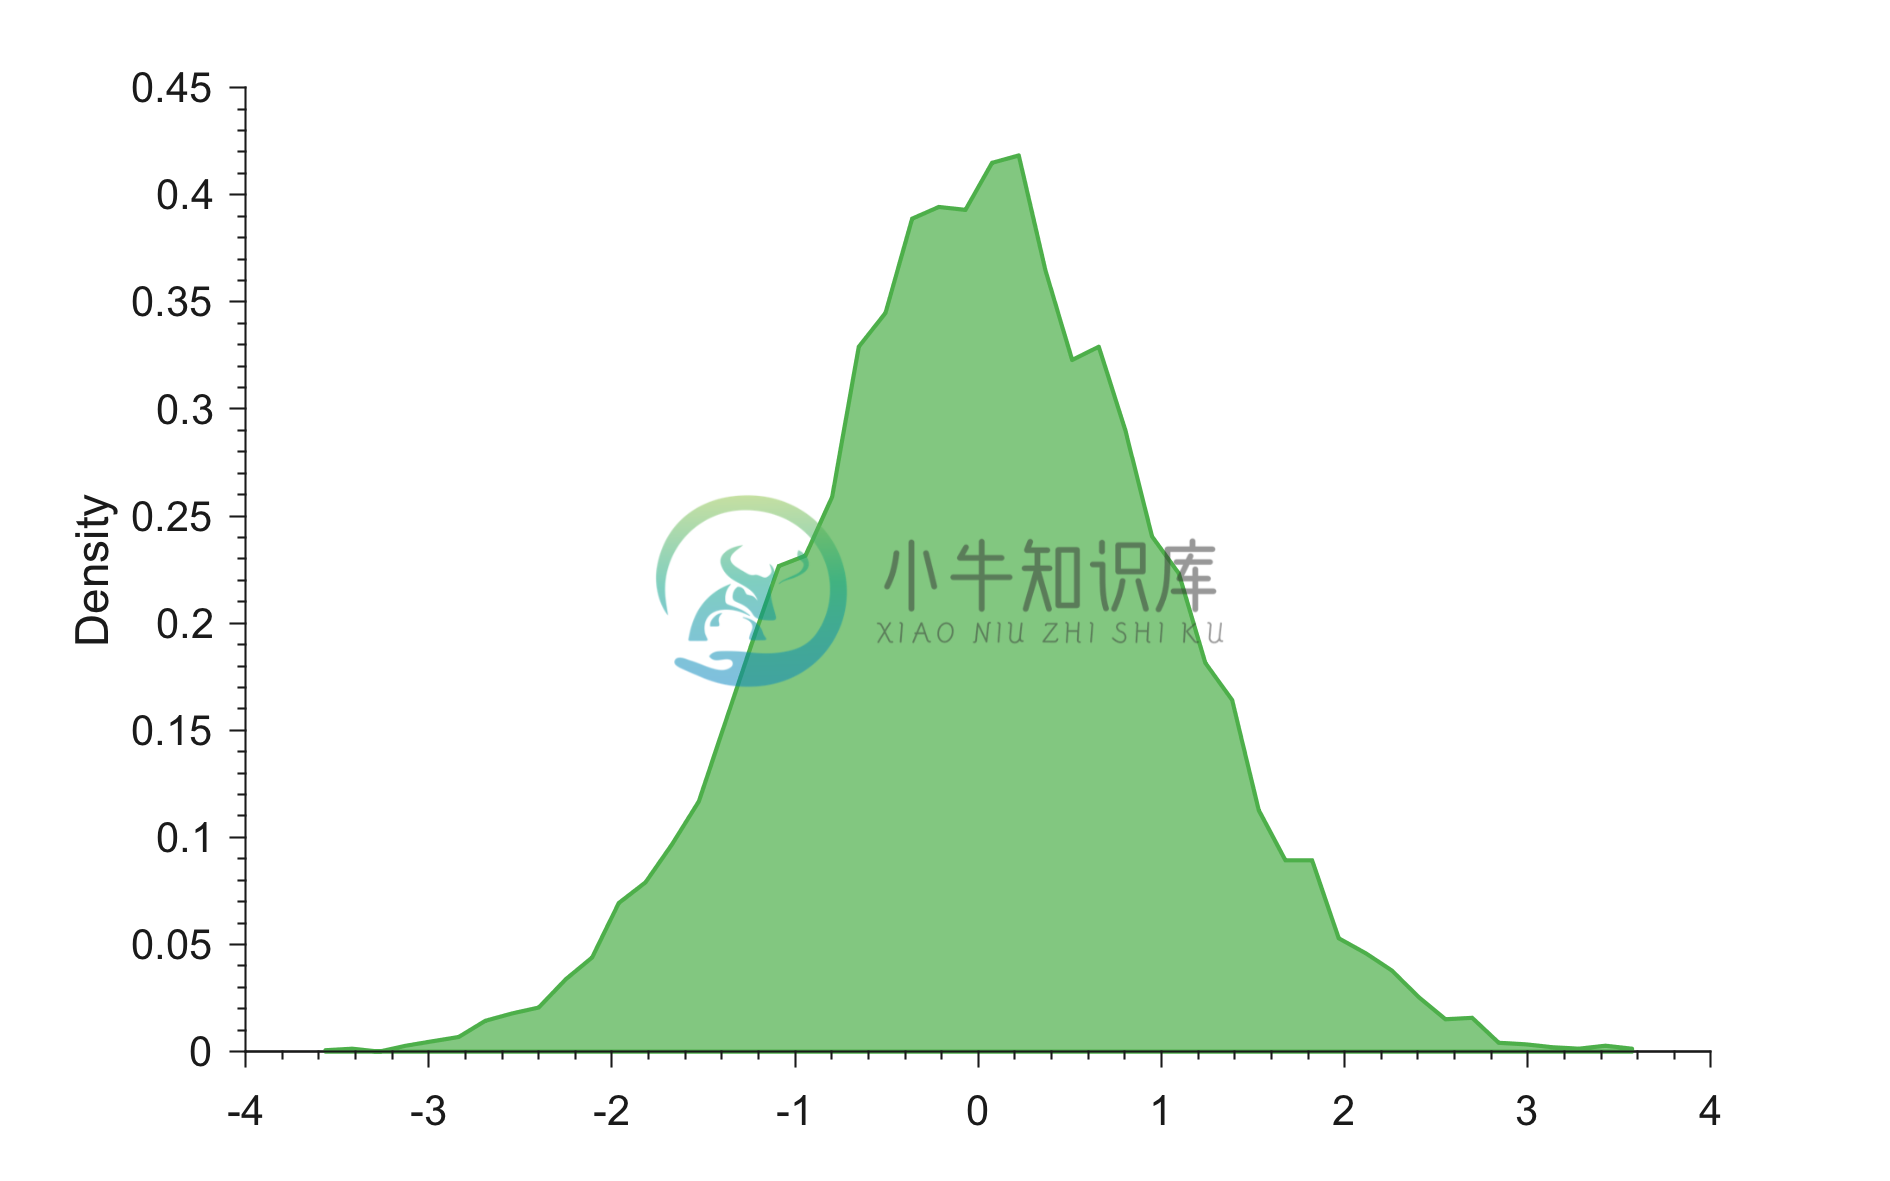
Example 6: Generating PDFs and saving figures
% Loading colors
run colors_definitions.m

% Generating random data
x = randn(1,1e4);

% Specifying the number of bins
no_of_bins = 50;

% Data for saving figure in png format (4 inputs required)
savefig = 1; % 1 --> you want to save figure
fig_name = 'generatePDF6';
fig_width_cm = 16;
fig_height_cm = 10;

figure;
generatePDF(x,color_scheme_set1(3,:),'area',no_of_bins,...
    savefig,fig_name,fig_width_cm,fig_height_cm)
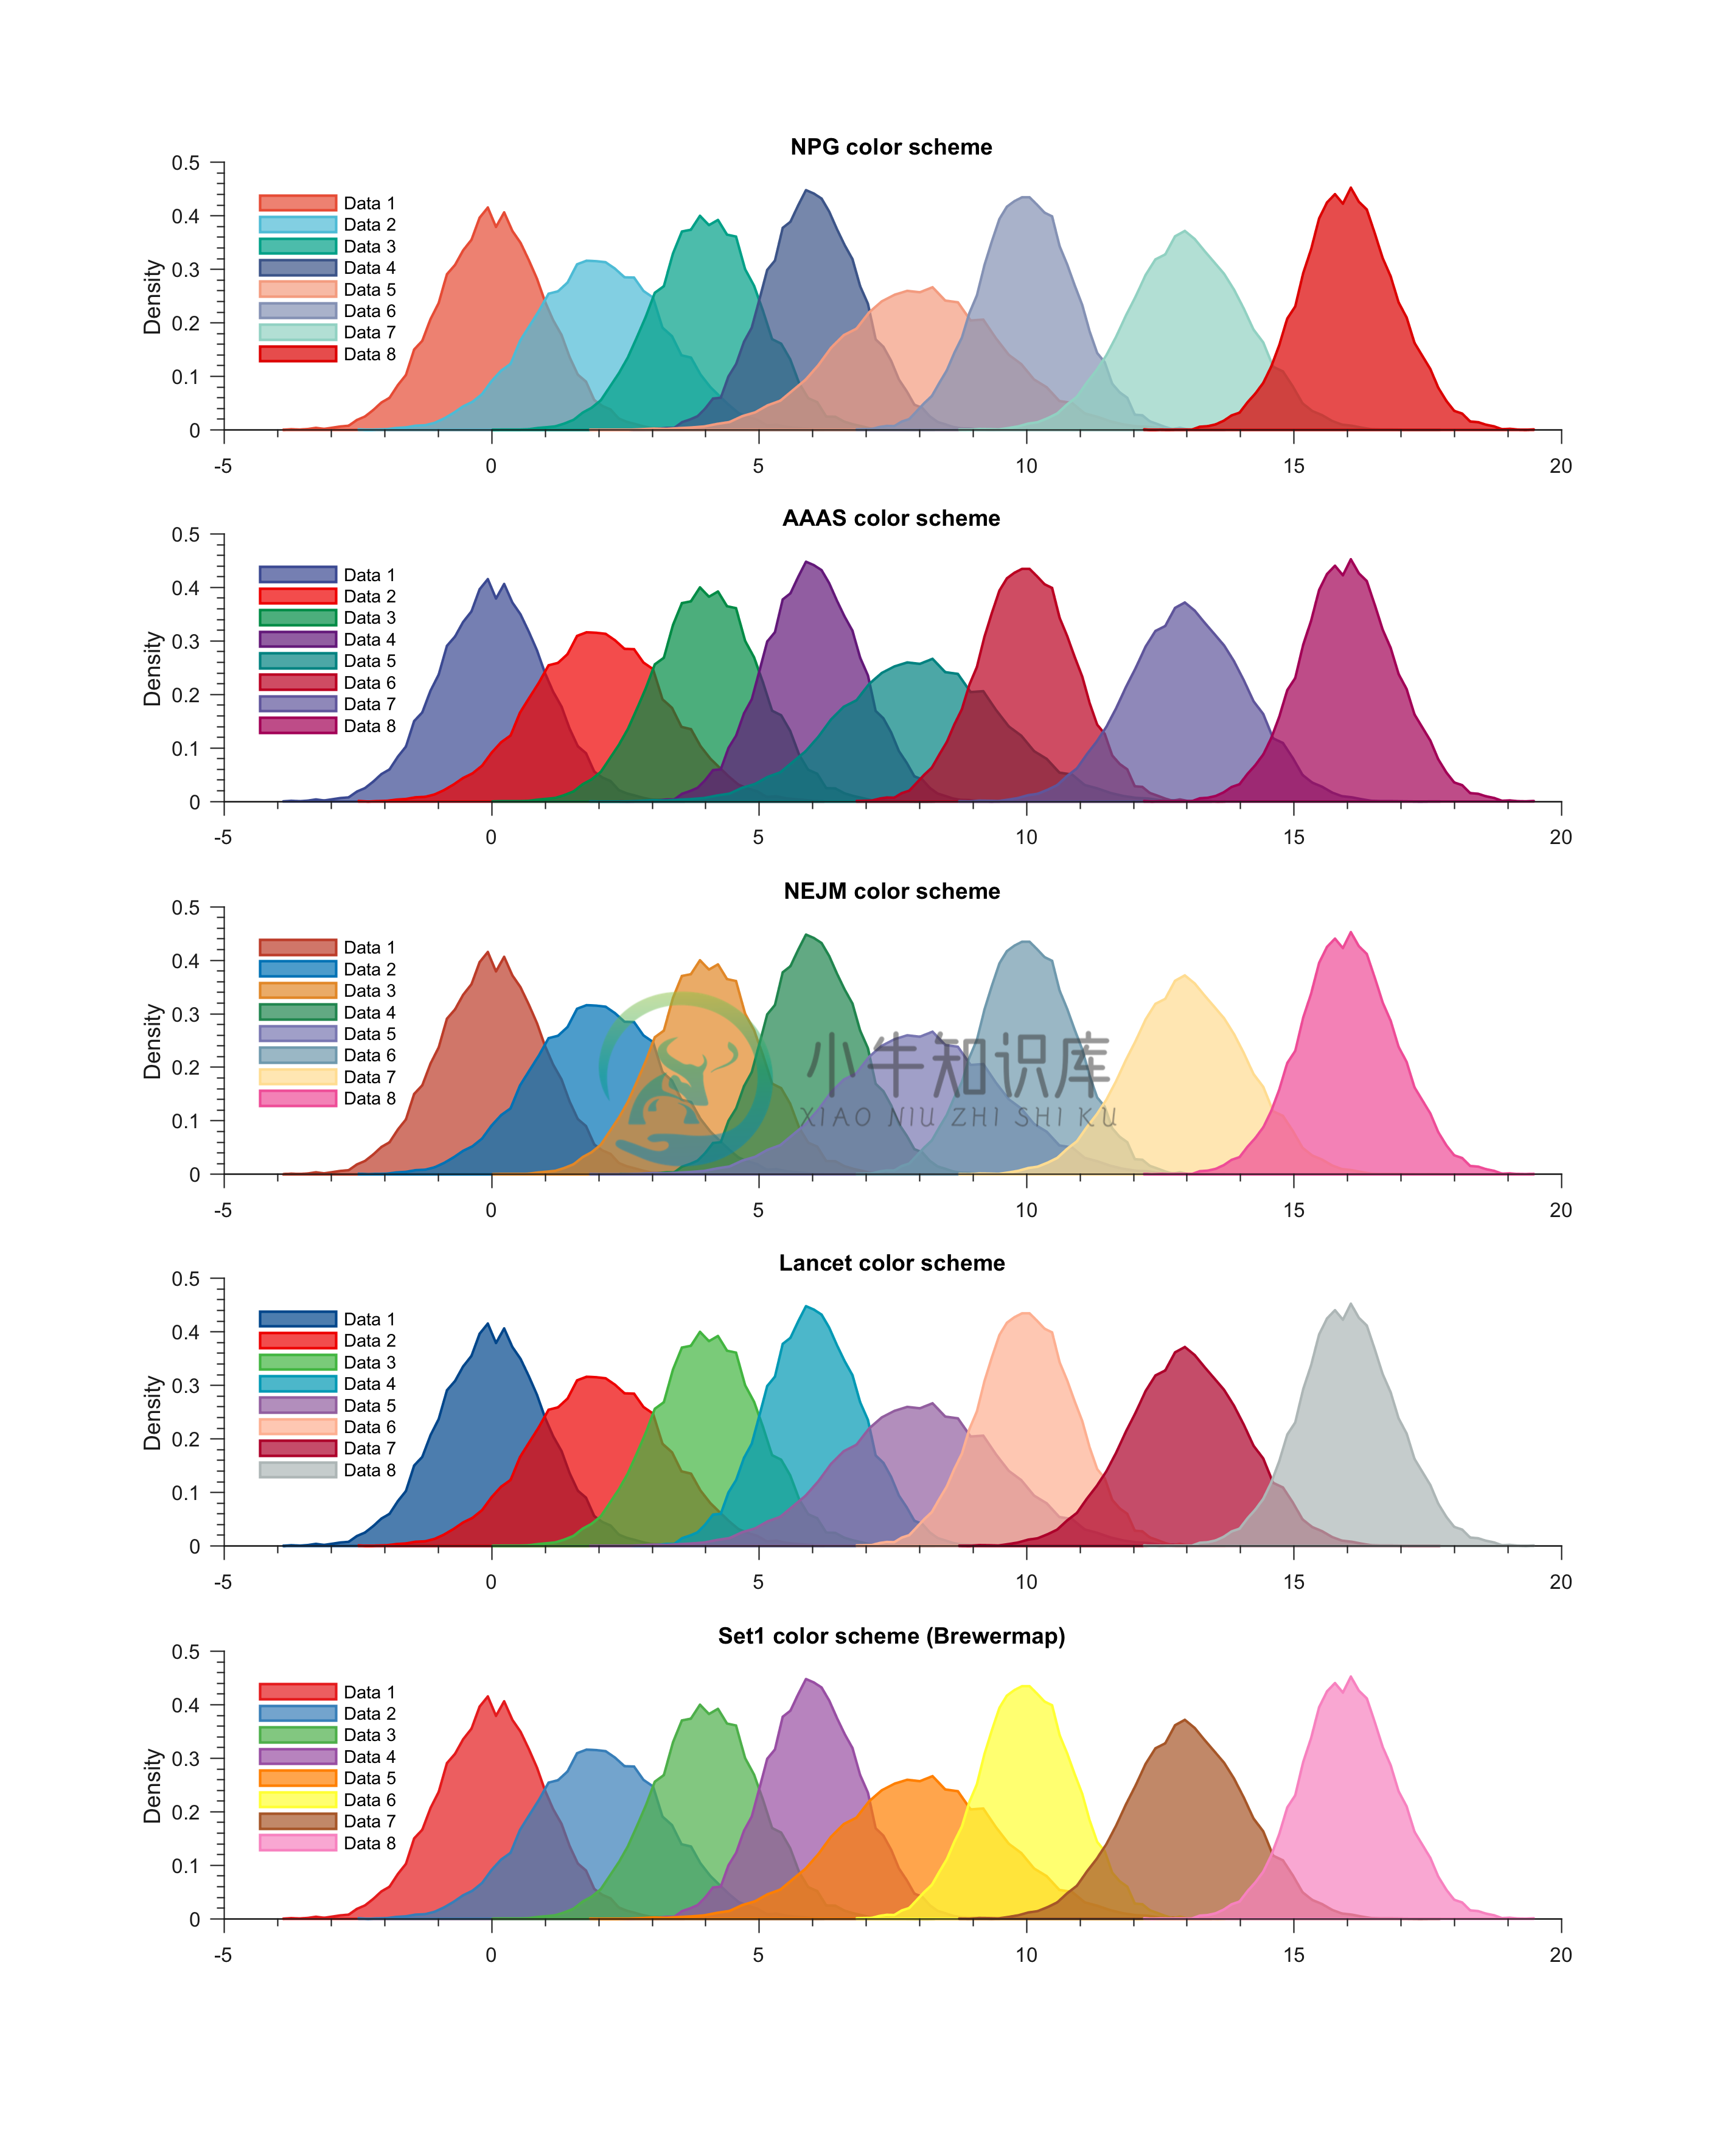
Example 7: Generating overlapping PDFs with different color schemes
% Loading colors
run colors_definitions.m

% Generating random data
num_samples = 2e4;

x(1,:) = randn(1,num_samples);
x(2,:) = 2 + 1.25 * randn(1,num_samples);
x(3,:) = 4 + randn(1,num_samples);
x(4,:) = 6 + 0.9 * randn(1,num_samples);
x(5,:) = 8 + 1.5 * randn(1,num_samples);
x(6,:) = 10 + 0.9 * randn(1,num_samples);
x(7,:) = 13 + 1.1 * randn(1,num_samples);
x(8,:) = 16 + 0.9 * randn(1,num_samples);

% Color schemes to test
no_color_schemes = 5;
color_scheme{1} = color_scheme_npg;
color_scheme{2} = color_scheme_aaas;
color_scheme{3} = color_scheme_nejm;
color_scheme{4} = color_scheme_lancet;
color_scheme{5} = color_scheme_set1;

titles_schemes = {'NPG color scheme','AAAS color scheme',...
    'NEJM color scheme','LANCET color scheme','Set1 (Brewermap) color scheme'};

figure;
for m = 1:no_color_schemes
    subplot(no_color_schemes,1,m)
    for k = 1:8
        generatePDF(x(k,:),color_scheme{m}(k,:),'area')
        hold on
    end
    title(titles_schemes{m})
    legend('Data 1','Data 2','Data 3',...
        'Data 4','Data 5','Data 6',...
        'Data 7','Data 8','Location','NorthWest'); legend boxoff
end
Heatmap
Generating heatmap in MATLAB using the default function heatmap.m (introduced in version 2017a) is quite useful for visualizing the magnitude of elements in matrices. However, the size of the generated heatmaps requires a lot of tweaking to produce a reasonable figure. Here, I have written a wrapper code for making nice appropriate-sized heatmaps quickly and efficiently with minimum input.
Function: figure_heatmap.m
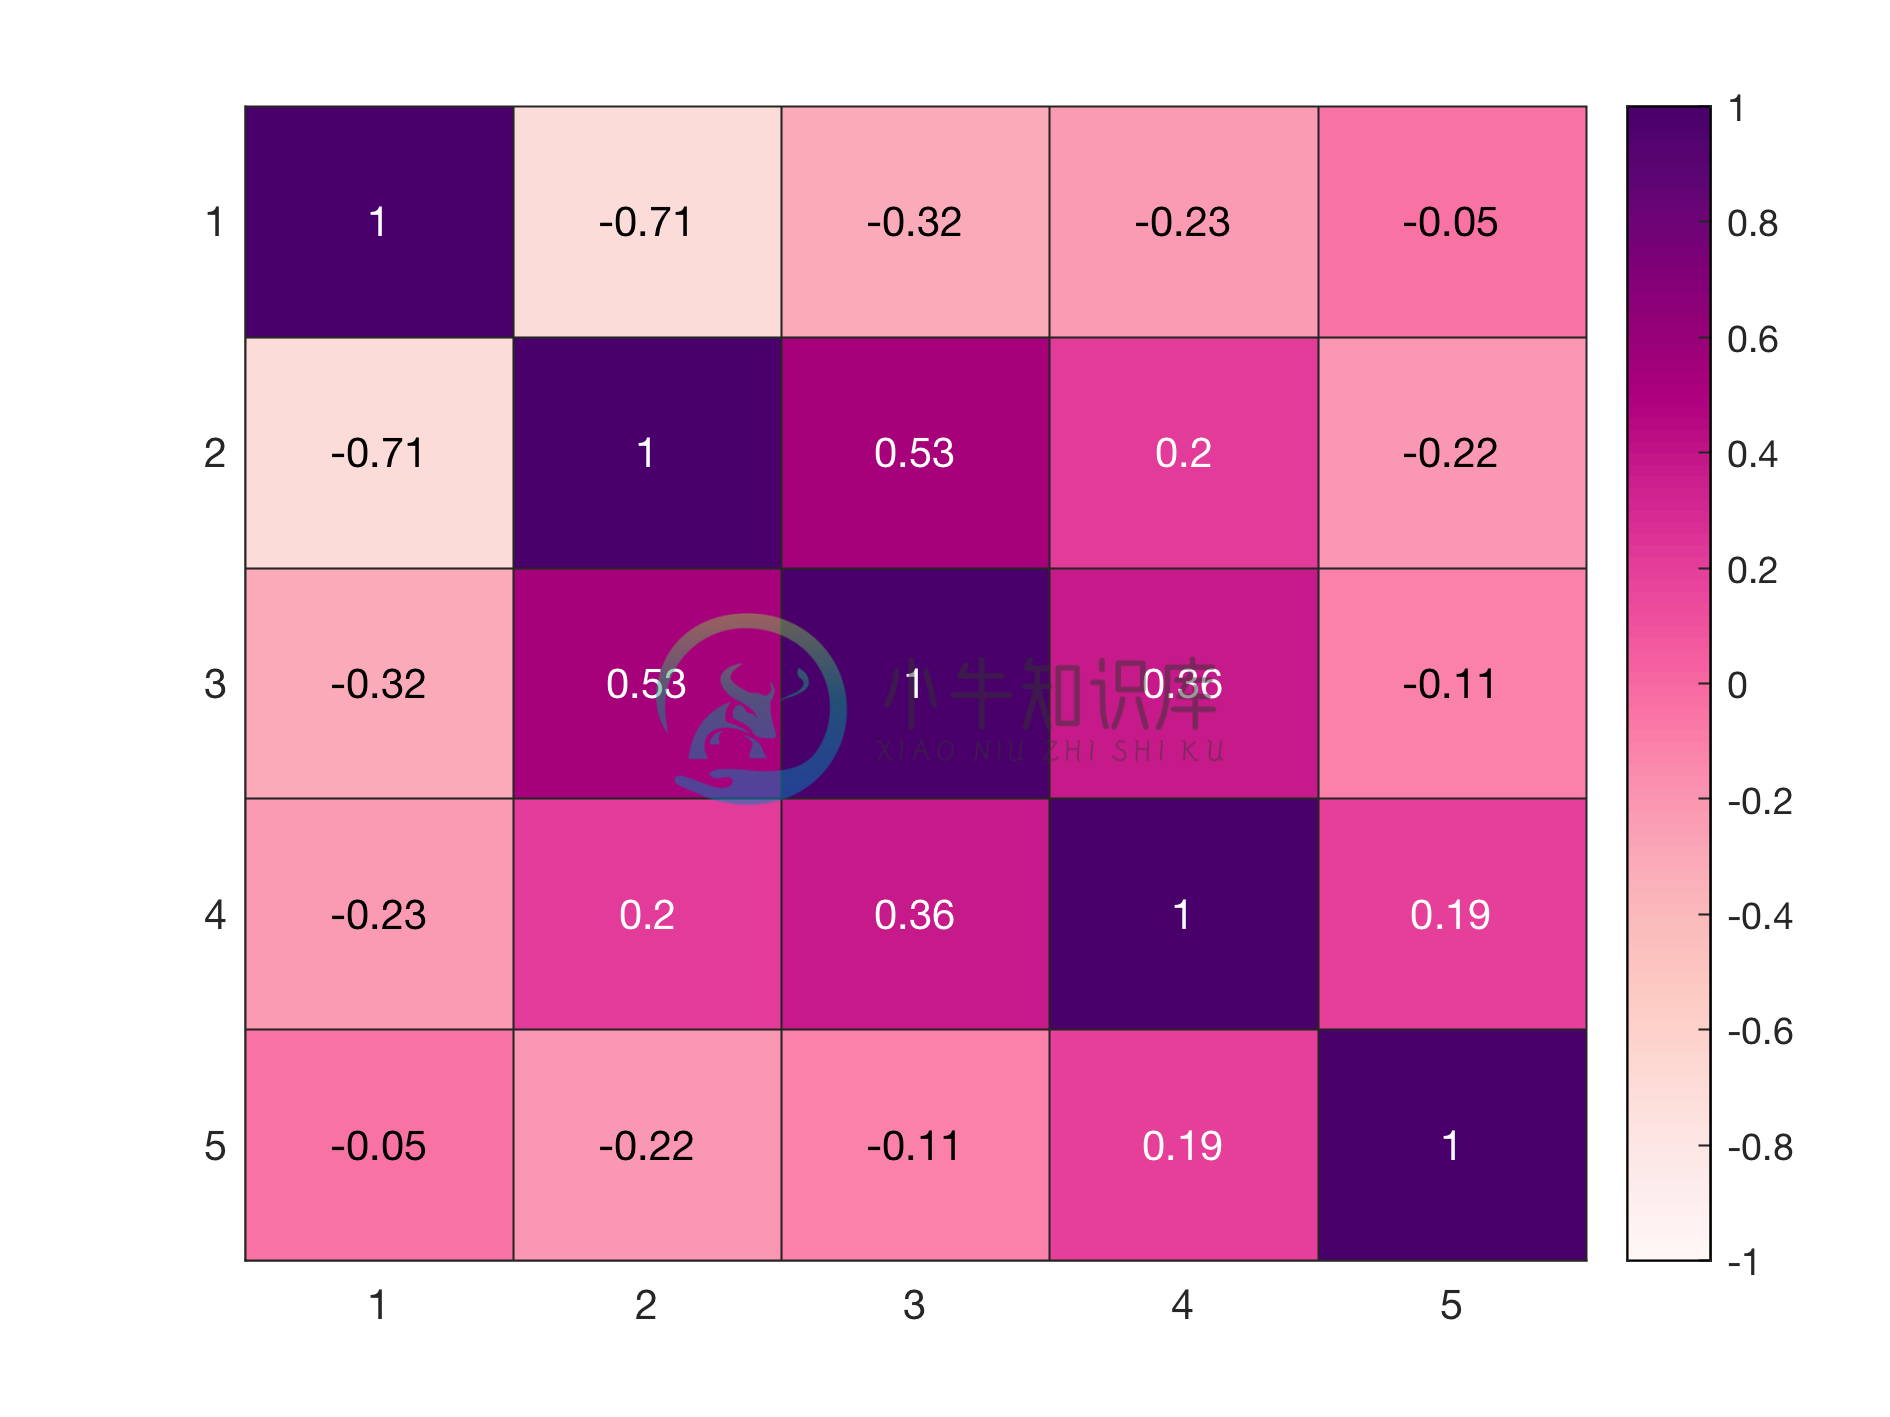
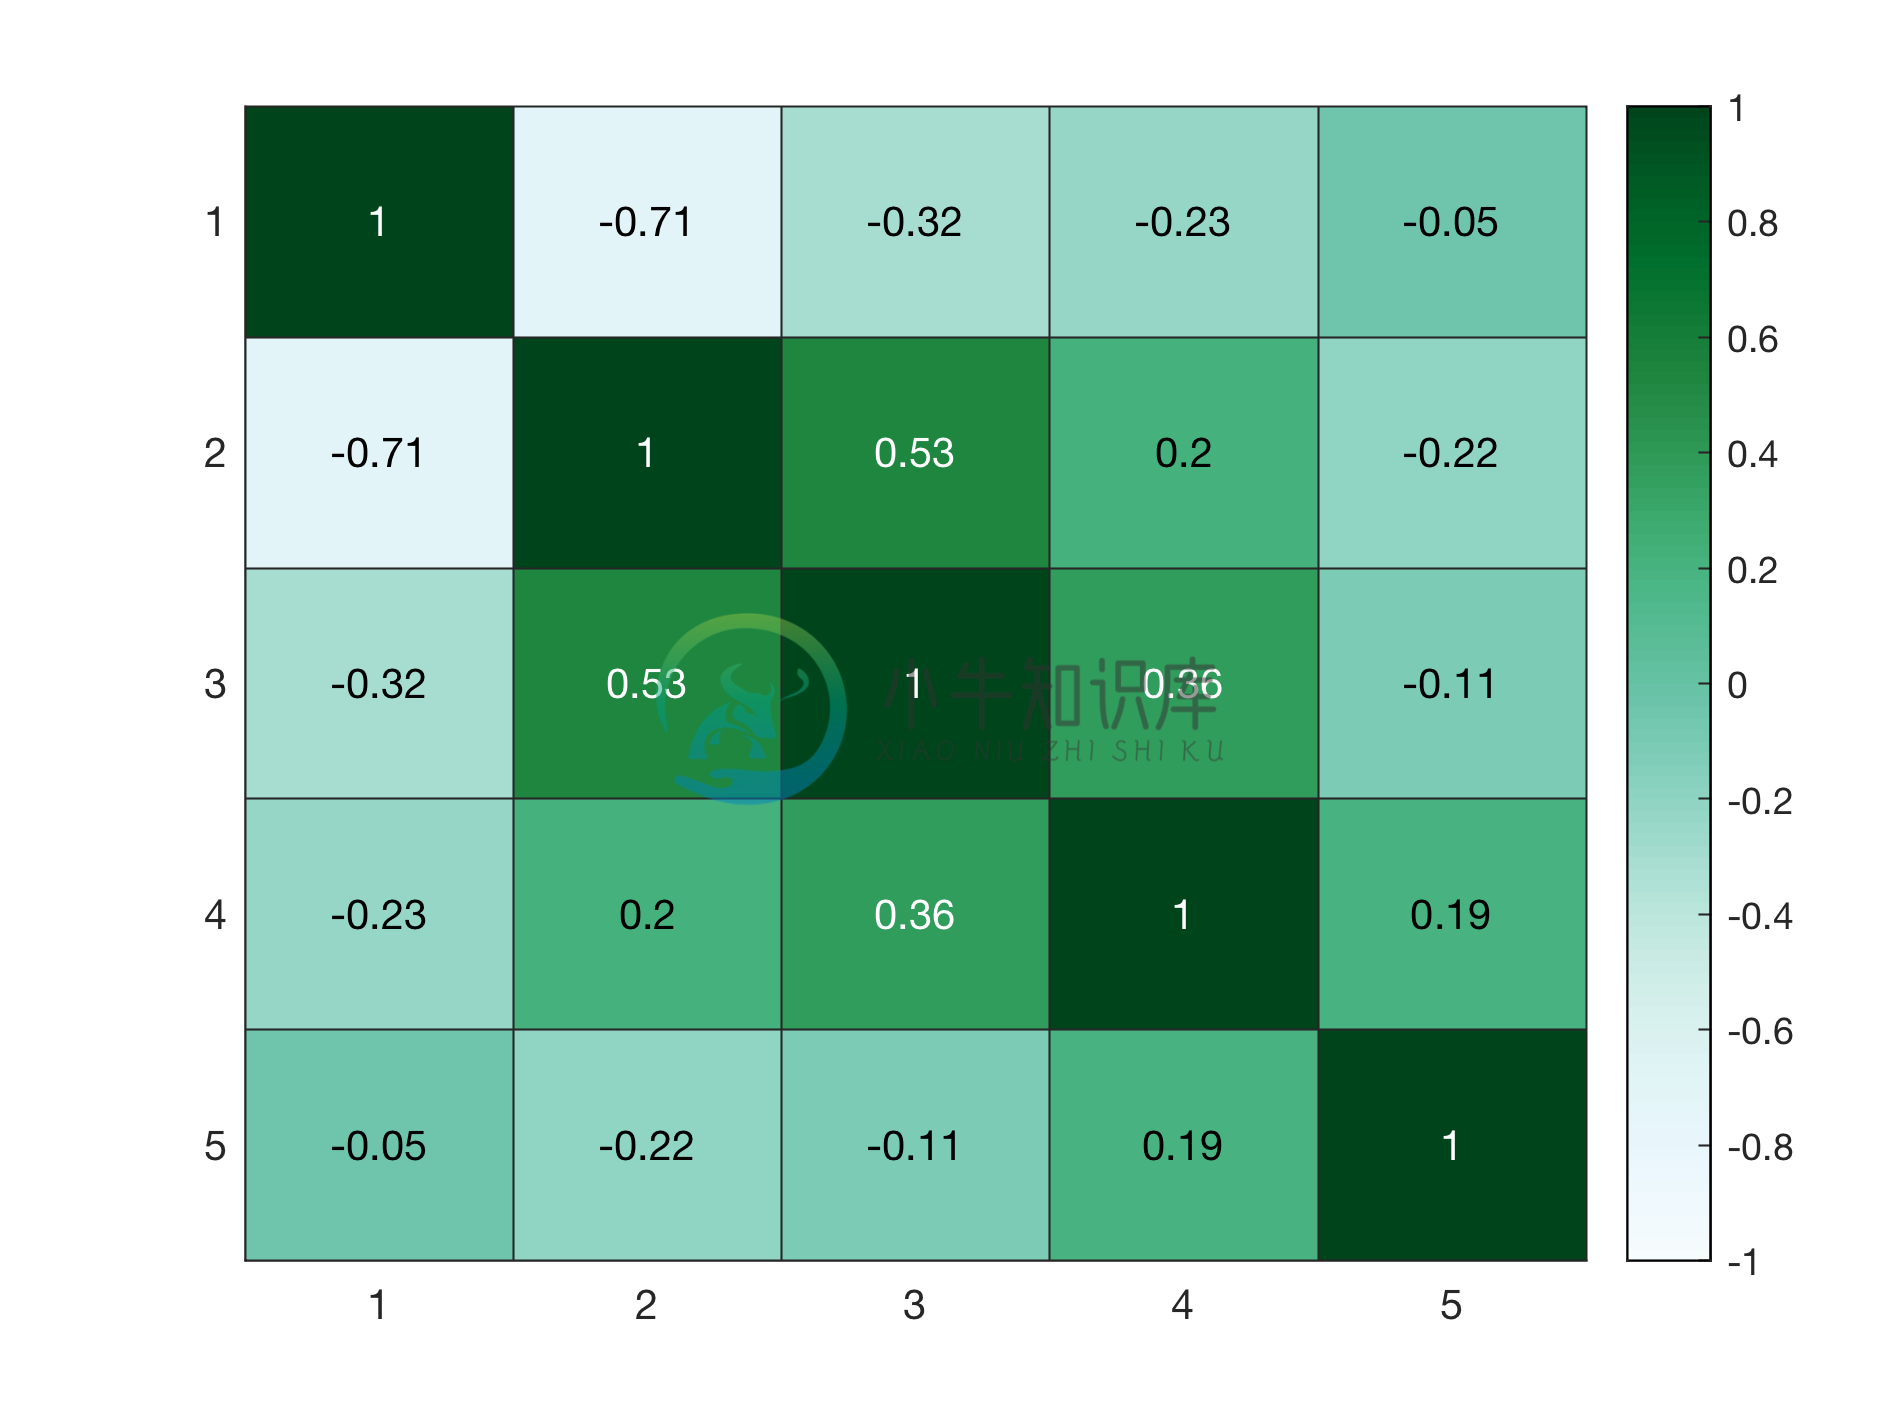
Example 1: Heatmap using only data input
% Generating data
x = randn(10,5);
C = corrcoef(x);

% Heatmap figure
figure_heatmap(C);
Example 2: Heatmap using a specific color scheme
%Using data of example 1

colorscheme = 'BuGn';
%Requires brewermap package
%Download from https://github.com/DrosteEffect/BrewerMap/blob/master/brewermap.m

% Heatmap figure
figure_heatmap(C,colorscheme);
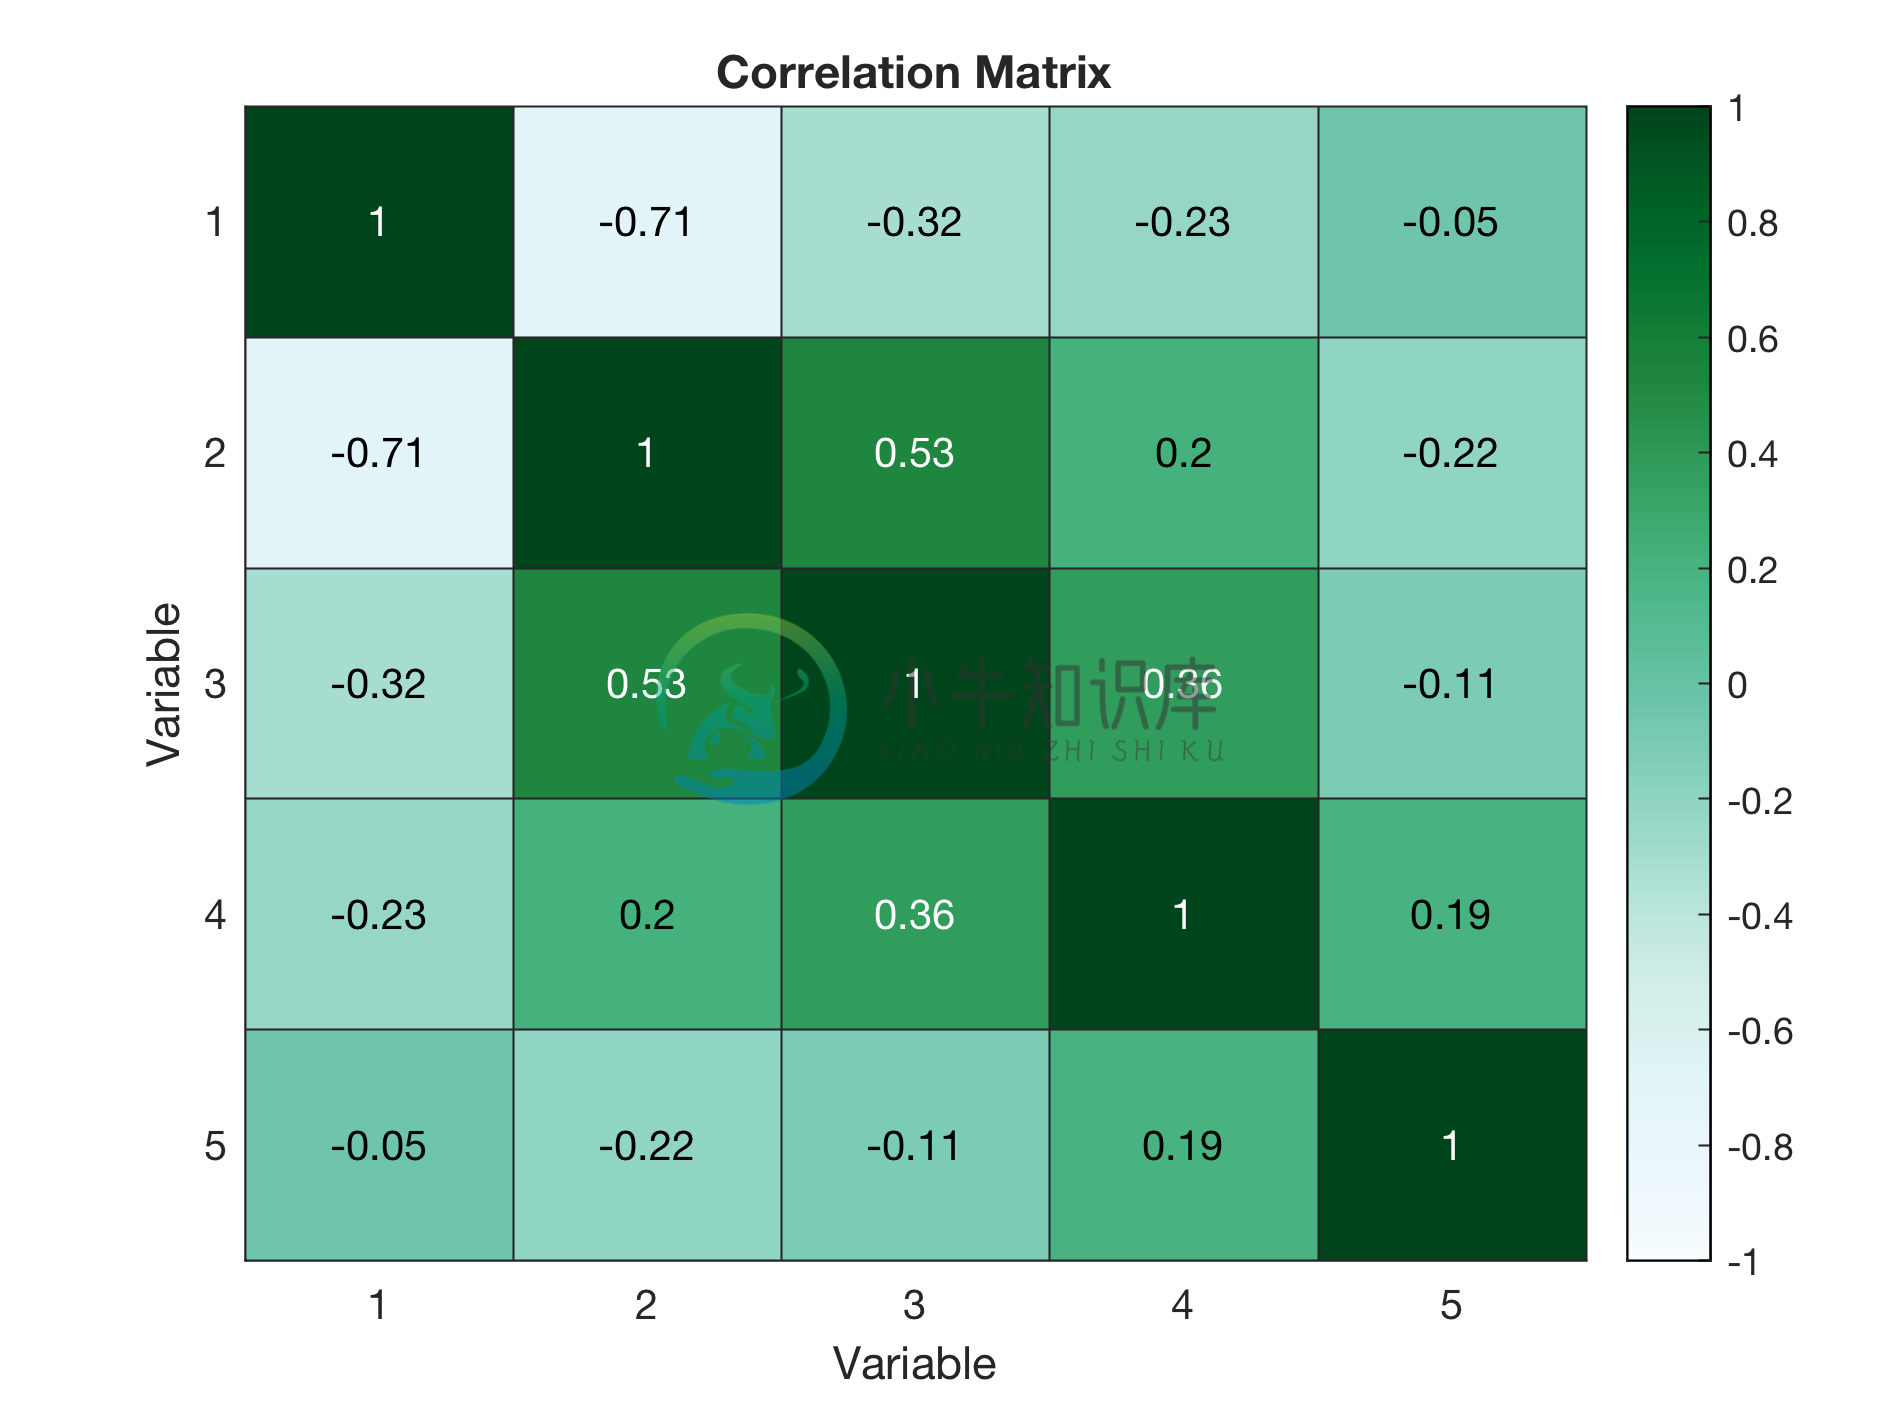
Example 3: Heatmap with title and labels
%Using data of example 1

colorscheme = 'BuGn';
%Requires brewermap package
%Download from https://github.com/DrosteEffect/BrewerMap/blob/master/brewermap.m
text_title = 'Correlation Matrix';
text_labels = {'Variable','Variable'};

% Heatmap figure
figure_heatmap(C,colorscheme,text_title,text_labels);
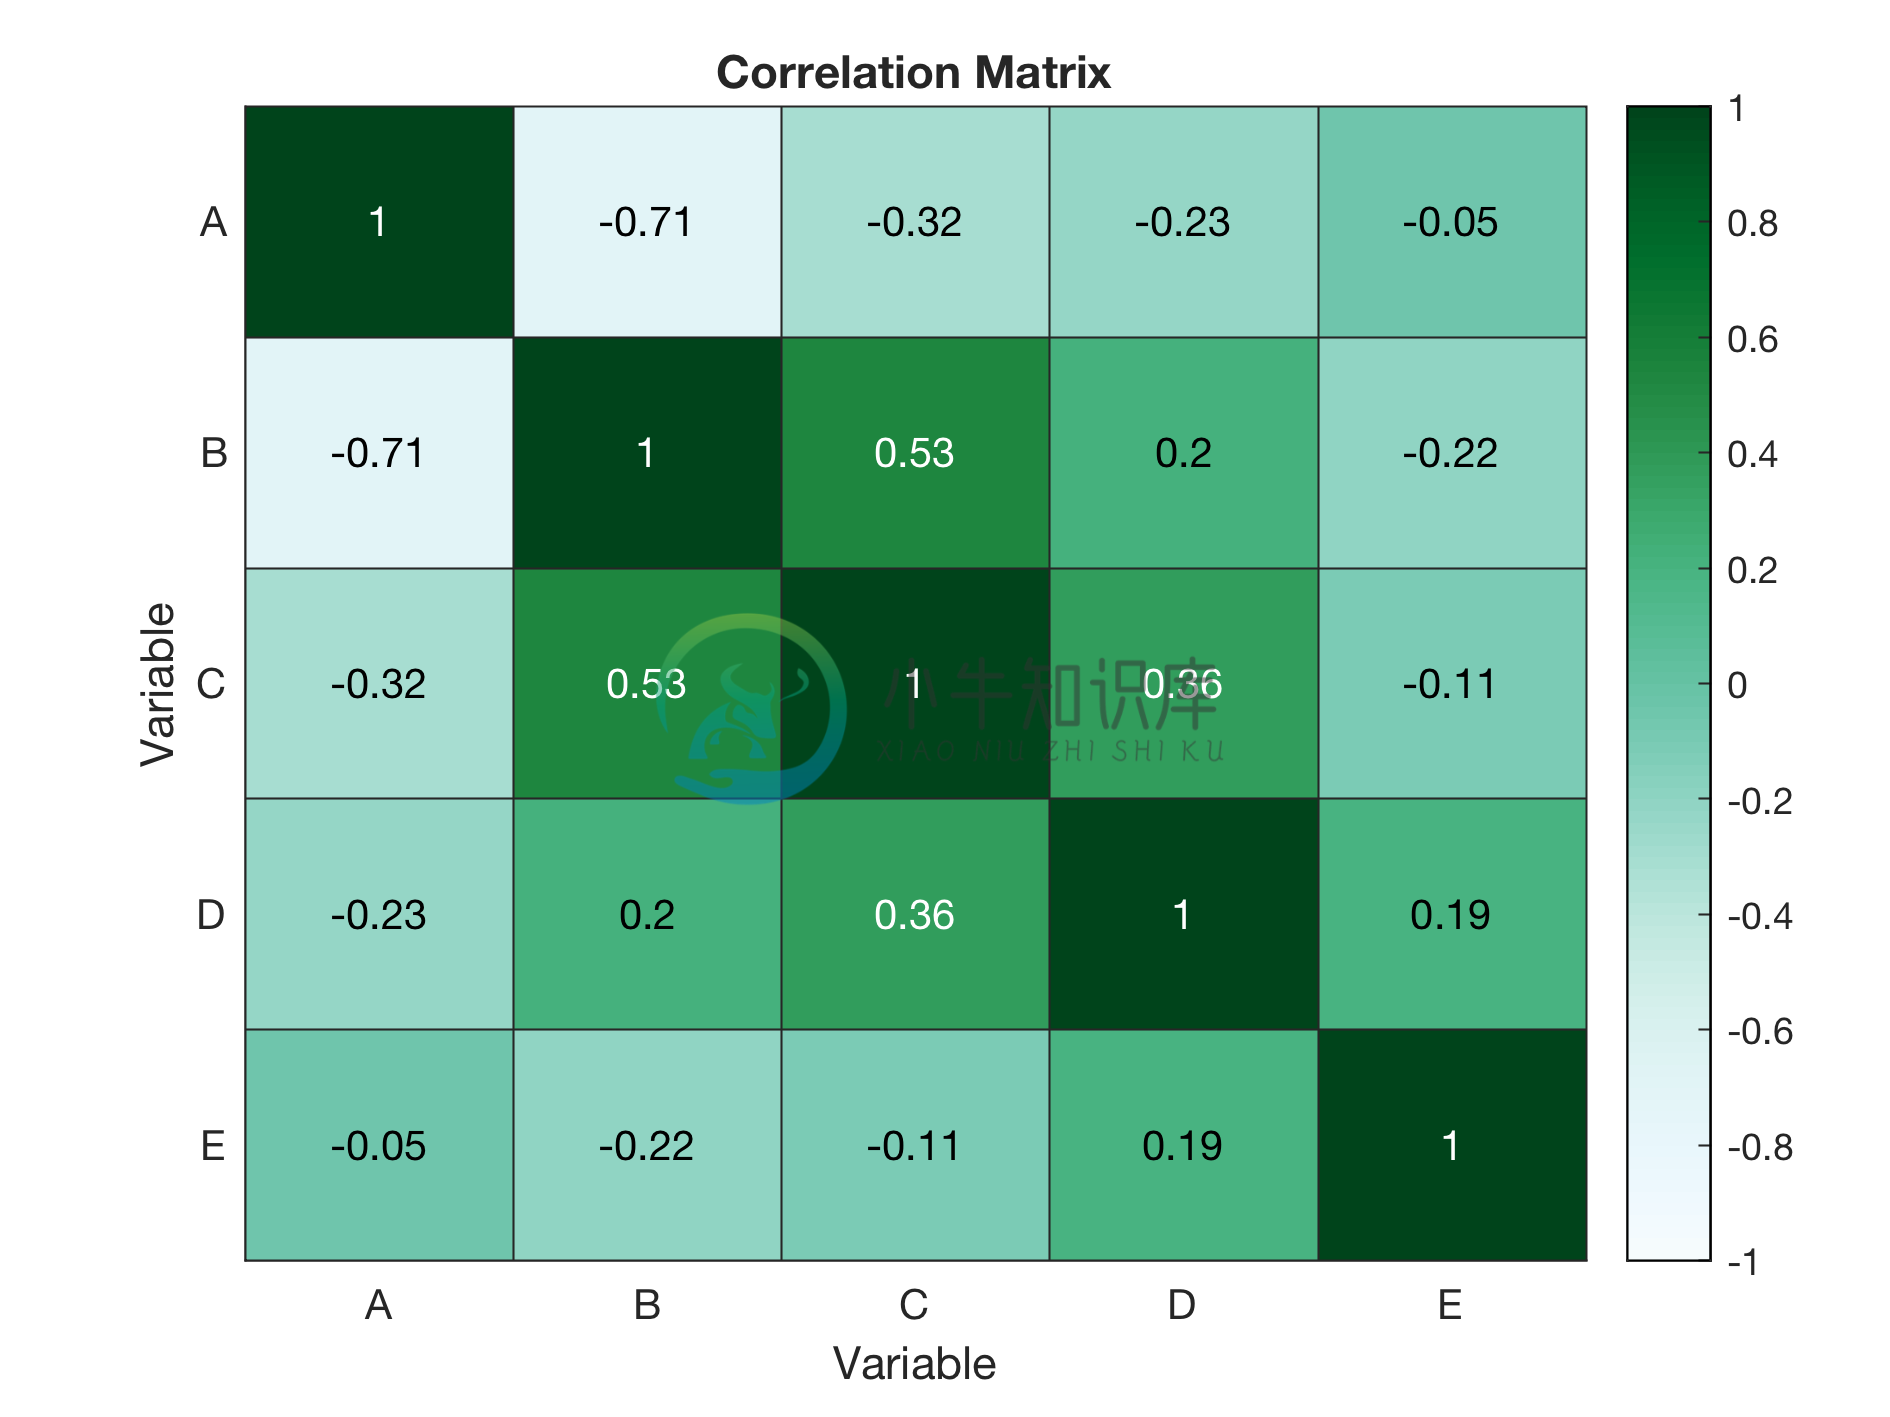
Example 4: Heatmap with cell labels and limits of color scheme specified
%Using data of example 1

colorscheme = 'BuGn';
%Requires brewermap package
%Download from https://github.com/DrosteEffect/BrewerMap/blob/master/brewermap.m
text_title = 'Correlation Matrix';
text_labels = {'Variable','Variable'};
limits_data = [-1 1]; %for correlation matrix
text_labels_cells{1} = {'A','B','C','D','E'}; %x-axis cell labels
text_labels_cells{2} = {'A','B','C','D','E'}; %y-axis cell labels

% Heatmap figure
figure_heatmap(C,colorscheme,text_title,text_labels,limits_data,text_labels_cells);
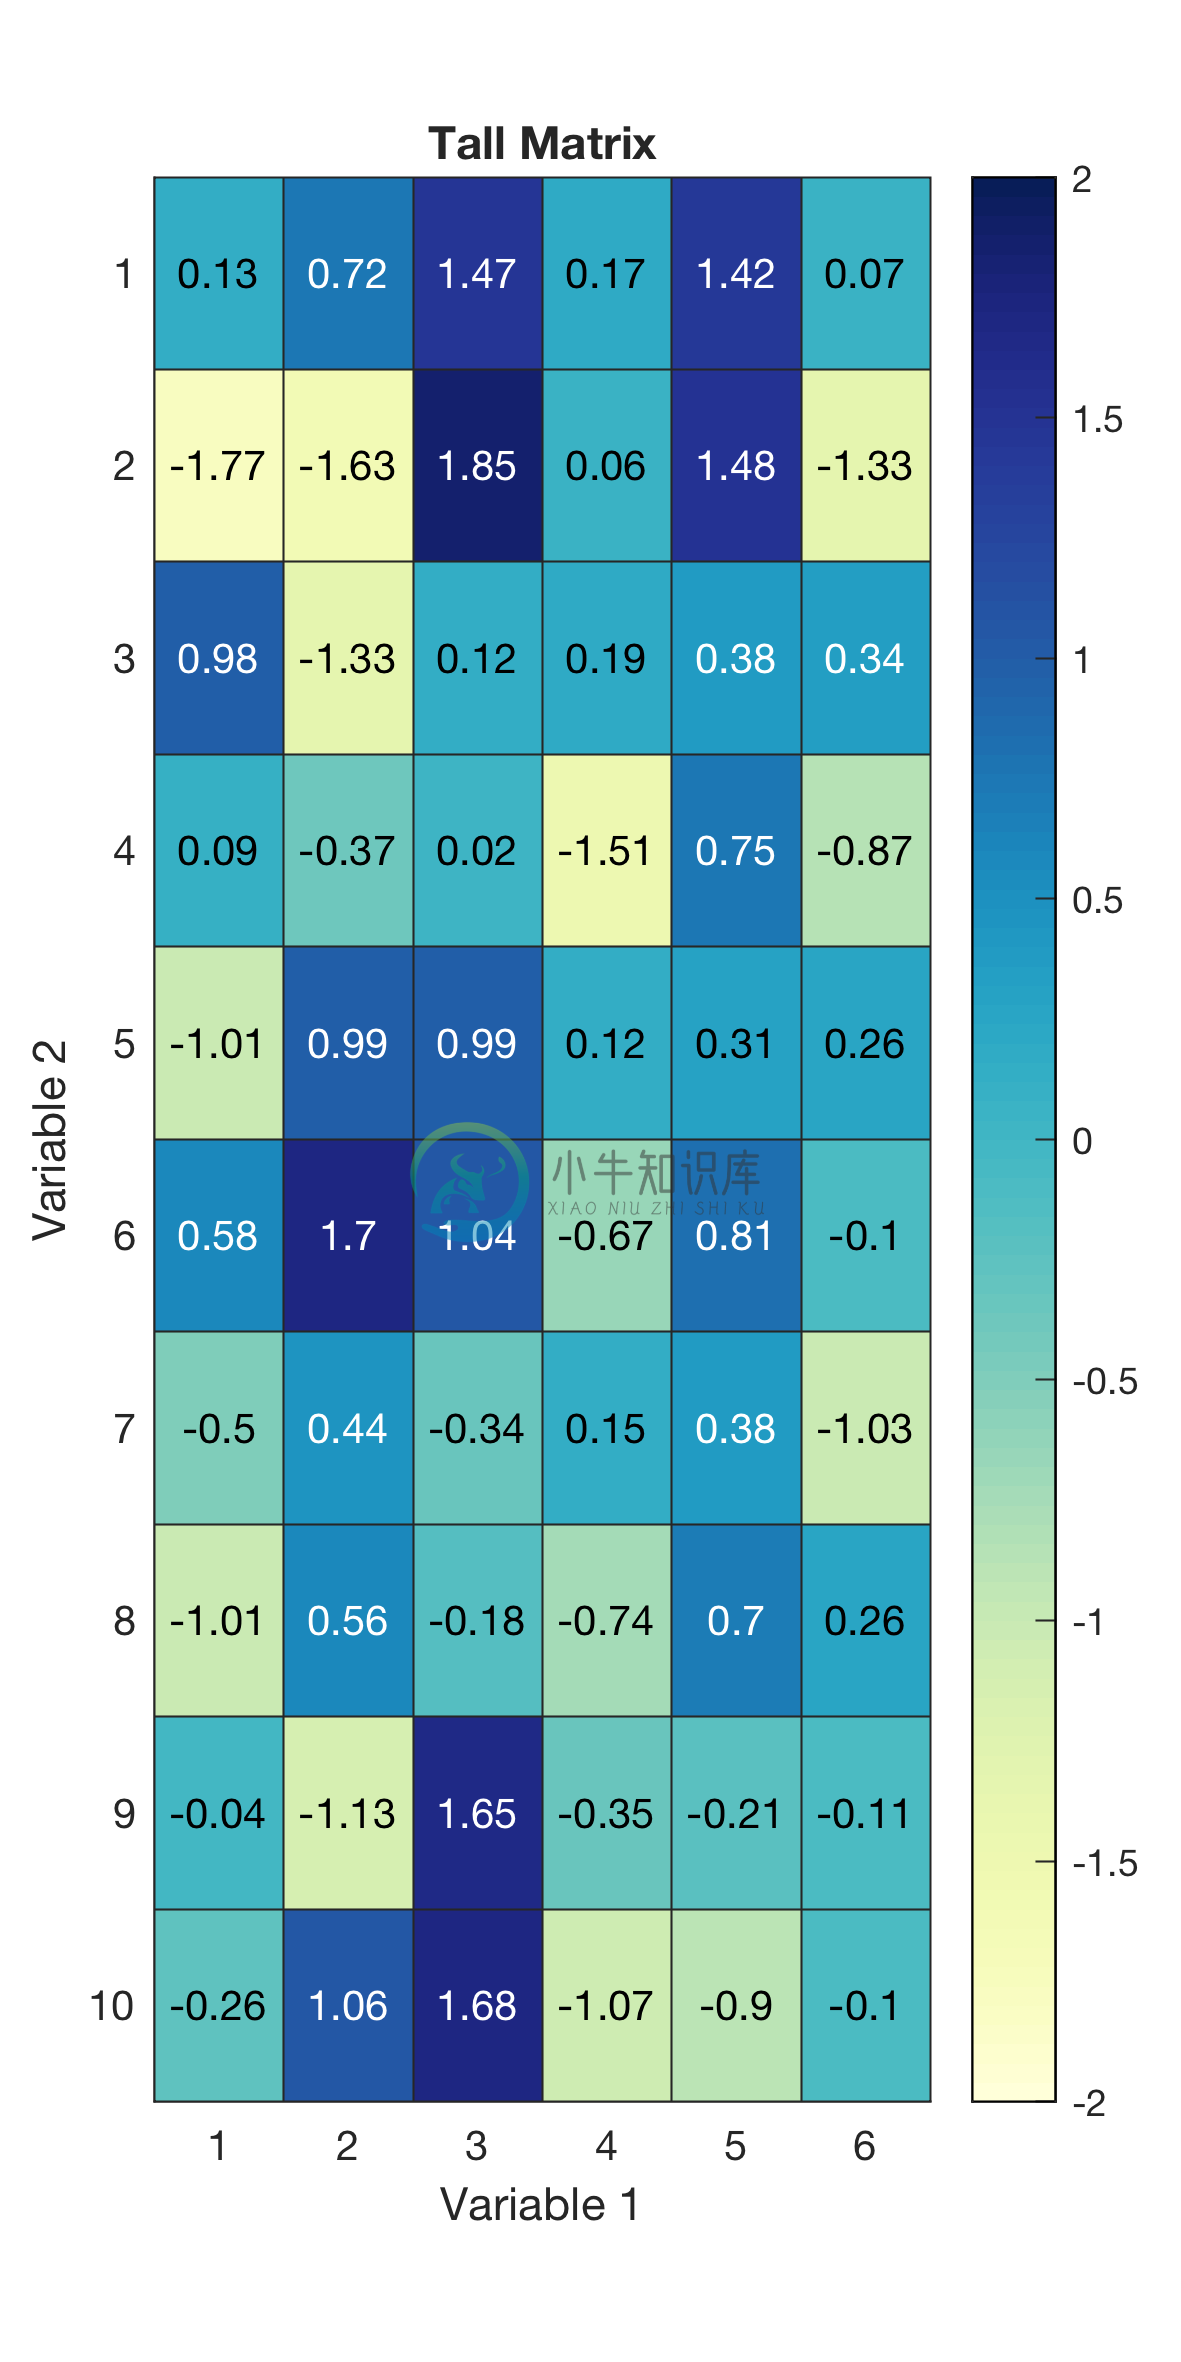
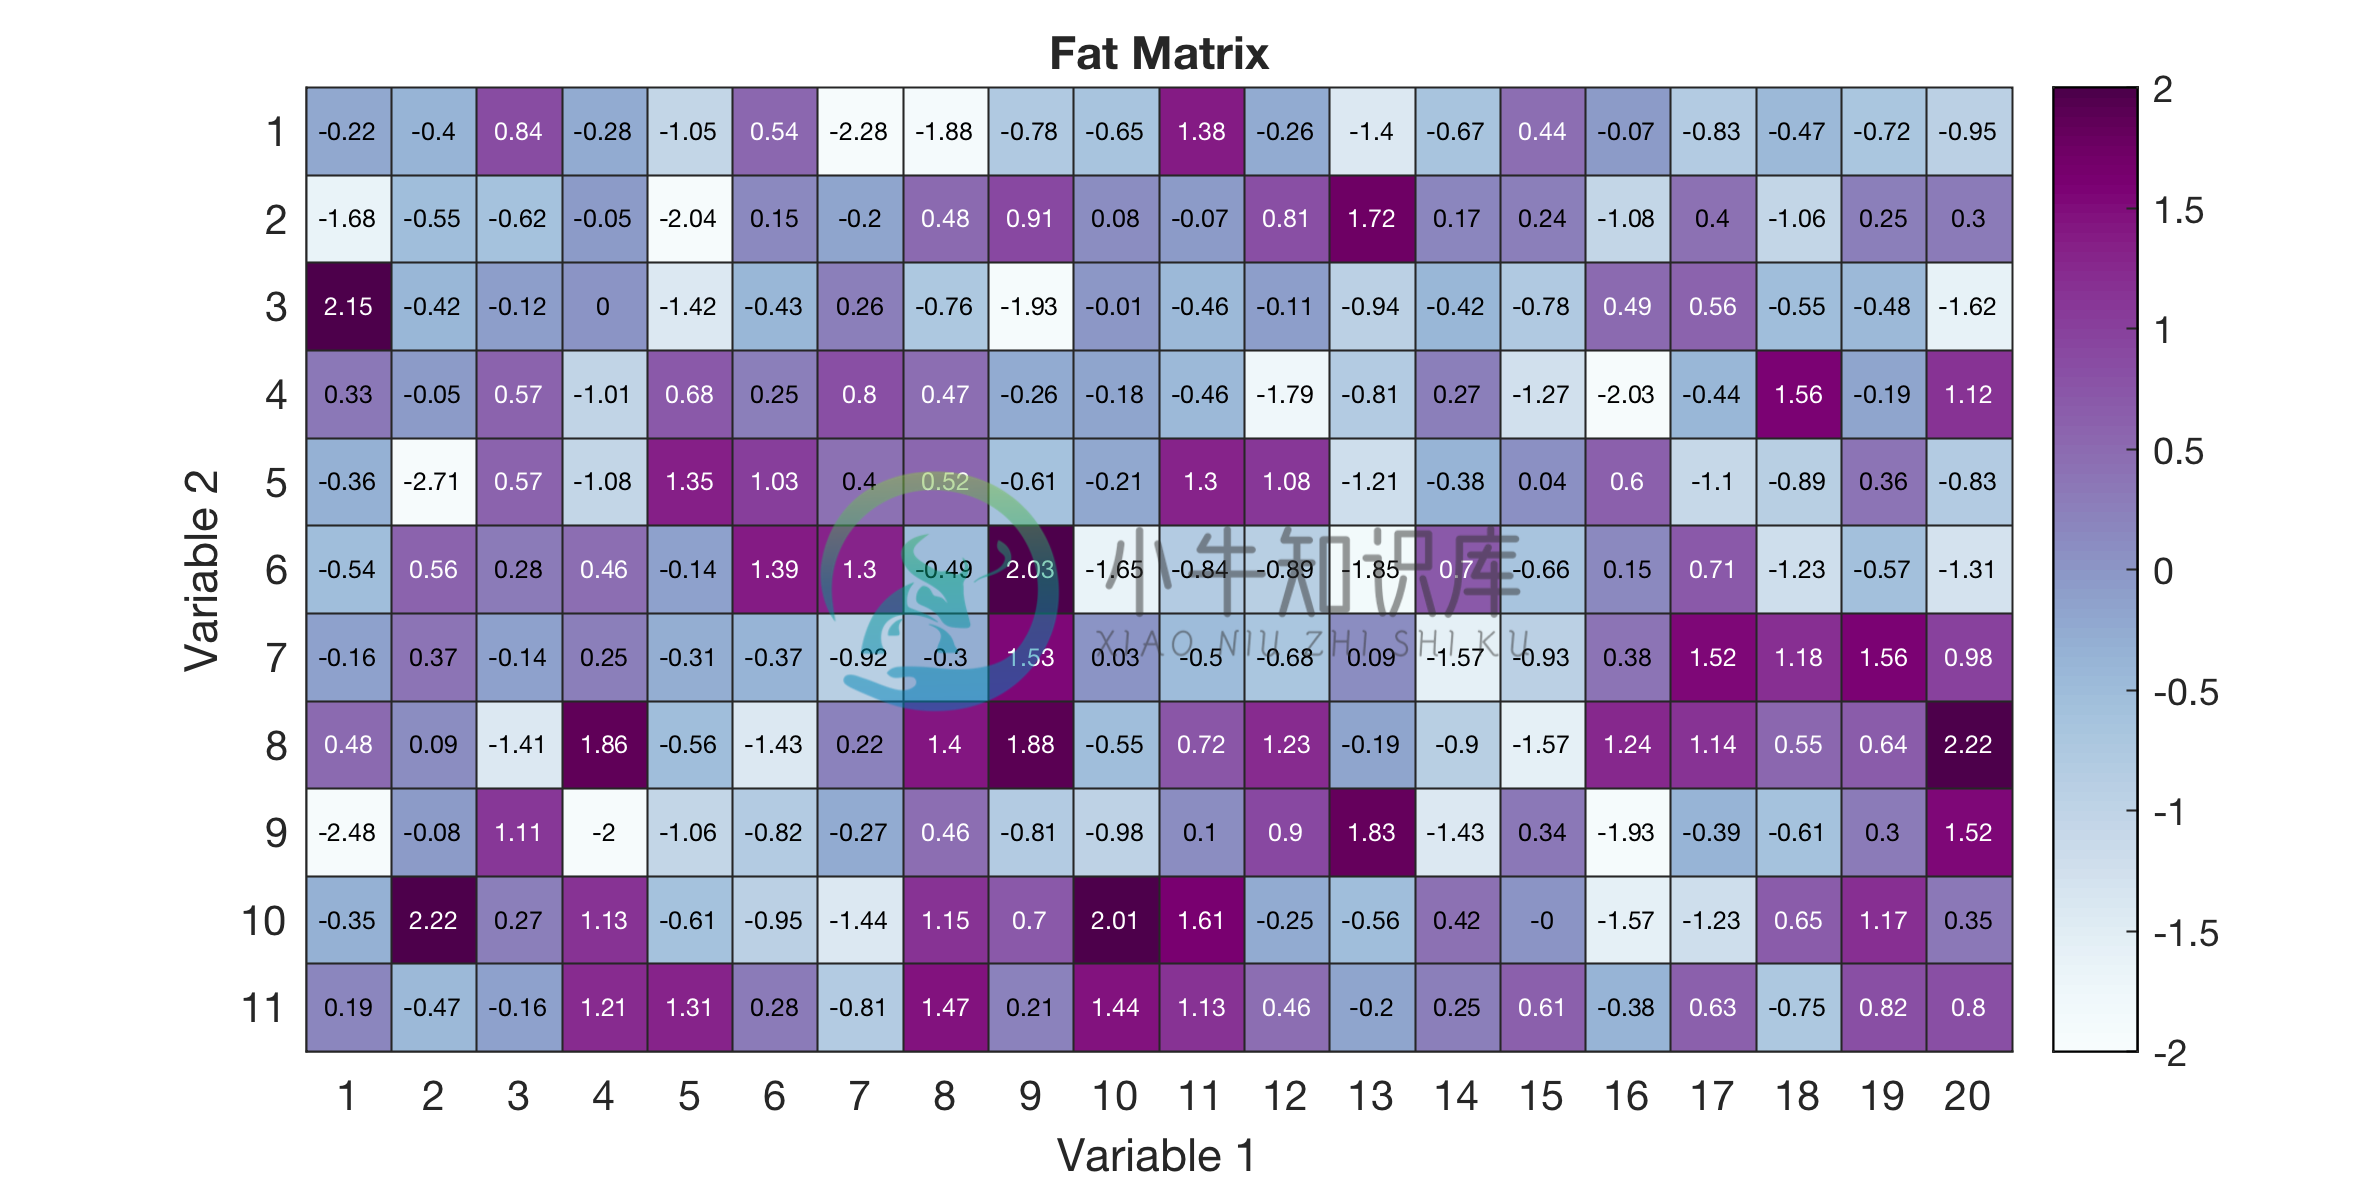
Example 5: Heatmap of a rectangular matrix and automated saving of figure with approproate cell sizes
% Generating rectangular matrix data
X = randn(10,6);
colorscheme = 'YlGnBu';
%Requires brewermap package
%Download from https://github.com/DrosteEffect/BrewerMap/blob/master/brewermap.m
text_title = 'Tall Matrix';
text_labels = {'Variable 1','Variable 2'};
limits_data = [floor(min(X(:))) ceil(max(X(:)))];
text_labels_cells{1} = 1:size(X,2); %x-axis cell labels
text_labels_cells{2} = 1:size(X,1); %y-axis cell labels
savefig = 1;
savefig_name = 'heatmap_example5a';

% Heatmap figure
figure_heatmap(X,colorscheme,text_title,text_labels,limits_data,text_labels_cells,...
    savefig,savefig_name);

%
Y = randn(11,20);
colorscheme = 'BuPu';
%Requires brewermap package
%Download from https://github.com/DrosteEffect/BrewerMap/blob/master/brewermap.m
text_title = 'Fat Matrix';
text_labels = {'Variable 1','Variable 2'};
limits_data = [floor(min(X(:))) ceil(max(X(:)))];
text_labels_cells{1} = 1:size(Y,2); %x-axis cell labels
text_labels_cells{2} = 1:size(Y,1); %y-axis cell labels
savefig = 1;
savefig_name = 'heatmap_example5b';

% Heatmap figure
figure;
figure_heatmap(Y,colorscheme,text_title,text_labels,limits_data,text_labels_cells,...
    savefig,savefig_name);
Example 6: Heatmap of a big data matrix
% Generating rectangular matrix data
X = randn(15,50);
colorscheme = 'BuPu';
%Requires brewermap package
%Download from https://github.com/DrosteEffect/BrewerMap/blob/master/brewermap.m
text_title = 'Big Rectangular Matrix';
text_labels = {'Variable 1','Variable 2'};
limits_data = [floor(min(X(:))) ceil(max(X(:)))];
text_labels_cells{1} = 1:size(X,2); %x-axis cell labels
text_labels_cells{2} = 1:size(X,1); %y-axis cell labels
savefig = 1;
savefig_name = 'heatmap_example6';

% Heatmap figure
figure_heatmap(X,colorscheme,text_title,text_labels,limits_data,text_labels_cells,...
    savefig,savefig_name);
Violinplot
In progress ...
Citation
If you find this repo useful, please cite it using the following information:
Plain Text
Ahmed Abdul Quadeer. (2019, December 18). ahmedaq/Making-elegant-Matlab-figures: Release v1.0 (Version v1.0). Zenodo. http://doi.org/10.5281/zenodo.3582848
Bibtex
@software{ahmed_abdul_quadeer_2019_3582848,author = {Ahmed Abdul Quadeer},title = {{ahmedaq/Making-elegant-Matlab-figures: Releasev1.0}},month = dec,year = 2019,publisher = {Zenodo},version = {v1.0},doi = {10.5281/zenodo.3582848},url = {https://doi.org/10.5281/zenodo.3582848}}
-
Elegant Git Elegant Git is an assistant who carefully automates routine work with Git. Please visit https://elegant-git.bees-hive.org/ to get started with user documentation orclick on the picture ��
-
Elegant Underline是一个简单的Android应用程序,用来演示如何创造更好的下划线文字效果。 这个简单的应用程序公开两个可能的实现: 基于路径的实现,需要API19 基于区域的实现,需要API1
-
Elegant Gnome Pack 是一个超级漂亮的 Ubuntu 主题,黑色风格,它提供了 PPA 源,所以安装起来非常方便。 # 安装:通过 PPA 源,支持 Ubuntu 10.04 / Linux Mint sudo add-apt-repository ppa:elegant-gnome/ppa sudo apt-get update sudo apt-get install eleg
-
决策是预期在执行程序时发生的条件并指定根据条件采取的行动。 决策结构评估多个表达式,这些表达式产生TRUE或FALSE作为结果。 如果结果为TRUE,则需要确定要采取的操作以及要执行的语句,否则需要执行FALSE。 以下是大多数编程语言中常见决策结构的一般形式 - Python编程语言将任何non-zero和non-null值假定为TRUE,如果它zero或null ,则假定为FALSE值。 Py
-
In order to fetch data from many web services, you need to provide authorization. There are many ways to do this, but perhaps the most common uses the Authorization HTTP header. Add Authorization Head
-
决策结构要求程序员指定一个或多个要由程序评估或测试的条件,以及在条件被确定为真时要执行的一个或多个语句,以及可选的,如果条件要执行的其他语句被认定是假的。 以下是大多数编程语言中常见决策结构的一般形式 - C ++编程语言提供以下类型的决策制定语句。 Sr.No 声明和说明 1 if 语句 'if'语句由一个布尔表达式后跟一个或多个语句组成。 2 if...else 语句 'if'语句后面可以跟一


