
matplotlib图例legend语法及设置的方法

1.图例legend基础语法及用法
legend语法参数如下: matplotlib.pyplot.legend(*args, **kwargs)
| Keyword | Description |
| loc | Location code string, or tuple (see below).图例所有figure位置 |
| prop | the font property字体参数 |
| fontsize | the font size (used only if prop is not specified) |
| markerscale | the relative size of legend markers vs. original 图例标记与原始标记的相对大小 |
| markerfirst | If True (default), marker is to left of the label. 如果为True,则图例标记位于图例标签的左侧 |
| numpoints | the number of points in the legend for line 为线条图图例条目创建的标记点数 |
| scatterpoints | the number of points in the legend for scatter plot 为散点图图例条目创建的标记点数 |
| scatteryoffsets | a list of yoffsets for scatter symbols in legend 为散点图图例条目创建的标记的垂直偏移量 |
| frameon | If True, draw the legend on a patch (frame). 控制是否应在图例周围绘制框架 |
| fancybox | If True, draw the frame with a round fancybox. 控制是否应在构成图例背景的FancyBboxPatch周围启用圆边 |
| shadow | If True, draw a shadow behind legend. 控制是否在图例后面画一个阴影 |
| framealpha | Transparency of the frame. 控制图例框架的 Alpha 透明度 |
| edgecolor | Frame edgecolor. |
| facecolor | Frame facecolor. |
| ncol | number of columns 设置图例分为n列展示 |
| borderpad | the fractional whitespace inside the legend border 图例边框的内边距 |
| labelspacing | the vertical space between the legend entries 图例条目之间的垂直间距 |
| handlelength | the length of the legend handles 图例句柄的长度 |
| handleheight | the height of the legend handles 图例句柄的高度 |
| handletextpad | the pad between the legend handle and text 图例句柄和文本之间的间距 |
| borderaxespad | the pad between the axes and legend border 轴与图例边框之间的距离 |
| columnspacing | the spacing between columns 列间距 |
| title | the legend title |
| bbox_to_anchor | the bbox that the legend will be anchored.指定图例在轴的位置 |
| bbox_transform | the transform for the bbox. transAxes if None. |
(1)设置图例位置
使用loc参数
| 0: ‘best' 1: ‘upper right' 2: ‘upper left' 3: ‘lower left' | 4: ‘lower right' 5: ‘right' 6: ‘center left' | 7: ‘center right' 8: ‘lower center' 9: ‘upper center' 10: ‘center' |
(2)设置图例字体
#设置字体大小
fontsize : int or float or {‘xx-small', ‘x-small', ‘small', ‘medium', ‘large', ‘x-large', ‘xx-large'}
(3)设置图例边框及背景
plt.legend(loc='best',frameon=False) #去掉图例边框
plt.legend(loc='best',edgecolor='blue') #设置图例边框颜色
plt.legend(loc='best',facecolor='blue') #设置图例背景颜色,若无边框,参数无效
(4)设置图例标题
plt.legend(loc='best',title="figure 1 legend") #去掉图例边框
2.legend面向对象命令
(1)获取并设置legend图例
plt.legend(loc=0, numpoints=1)
leg = plt.gca().get_legend() #或leg=ax.get_legend()
ltext = leg.get_texts()
plt.setp(ltext, fontsize=12,fontweight='bold')
(2)设置图例
legend = ax.legend((rectsTest1, rectsTest2, rectsTest3), ('test1', 'test2', 'test3'))
legend = ax.legend(loc='upper center', shadow=True, fontsize='x-large')
legend.get_frame().set_facecolor('red') #设置图例legend背景为红色
frame = legend.get_frame()
frame.set_alpha(1)
frame.set_facecolor('none') #设置图例legend背景透明
(3)移除图例
ax1.legend_.remove() ##移除子图ax1中的图例
ax2.legend_.remove() ##移除子图ax2中的图例
ax3.legend_.remove() ##移除子图ax3中的图例
3.案例:设置图例legend到图形边界外
#主要是bbox_to_anchor的使用
box = ax1.get_position()
ax1.set_position([box.x0, box.y0, box.width , box.height* 0.8])
ax1.legend(loc='center', bbox_to_anchor=(0.5, 1.2),ncol=3)
4.案例:显示多图例legend
import matplotlib.pyplot as plt
import numpy as np
x = np.random.uniform(-1, 1, 4)
y = np.random.uniform(-1, 1, 4)
p1, = plt.plot([1,2,3])
p2, = plt.plot([3,2,1])
l1 = plt.legend([p2, p1], ["line 2", "line 1"], loc='upper left')

p3 = plt.scatter(x[0:2], y[0:2], marker = 'D', color='r')
p4 = plt.scatter(x[2:], y[2:], marker = 'D', color='g')
# This removes l1 from the axes.
plt.legend([p3, p4], ['label', 'label1'], loc='lower right', scatterpoints=1)
# Add l1 as a separate artist to the axes
plt.gca().add_artist(l1)

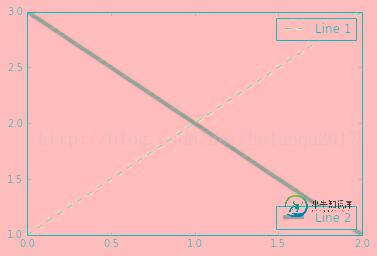
import matplotlib.pyplot as plt
line1, = plt.plot([1,2,3], label="Line 1", linestyle='--')
line2, = plt.plot([3,2,1], label="Line 2", linewidth=4)
# 为第一个线条创建图例
first_legend = plt.legend(handles=[line1], loc=1)
# 手动将图例添加到当前轴域
ax = plt.gca().add_artist(first_legend)
# 为第二个线条创建另一个图例
plt.legend(handles=[line2], loc=4)
plt.show()
到此这篇关于matplotlib图例legend语法及设置的方法的文章就介绍到这了,更多相关matplotlib legend内容请搜索小牛知识库以前的文章或继续浏览下面的相关文章希望大家以后多多支持小牛知识库!
-
本文向大家介绍matplotlib设置legend图例代码示例,包括了matplotlib设置legend图例代码示例的使用技巧和注意事项,需要的朋友参考一下 本文主要是关于matplotlib的一些基本用法。 Demo 结果展示: 总结 以上就是本文关于matplotlib设置legend图例代码示例的全部内容,希望对大家有所帮助。感兴趣的朋友可以继续参阅本站其他相关专题,如有不足之处,欢迎留言
-
我有这样一个代码: 从图中可以看出,Fontsize中的设置不影响图例标题字体大小。 如何将图例标题的字体大小设置为较小的大小?
-
显示图表上出现的区域数据集的图例。 配置选项 图例配置在 options.legend 中.全局配置在 Chart.defaults.global.legend。 名称 类型 默认值 描述 display Boolean true 是否显示 position String 'top' 位置 更多... fullWidth Boolean true 是否铺满画布,此配置不常改变 onClick Fu
-
本文向大家介绍matplotlib中legend位置调整解析,包括了matplotlib中legend位置调整解析的使用技巧和注意事项,需要的朋友参考一下 在画一些曲线图(linecharts)时,常常会出现多条曲线同时画在一张图上面,这时候就需要对不同的曲线进行不同的标注,以使读者能够清晰地知道每条曲线代表的含义。当你画很少的几条曲线时,这时画图命令中自动产生的legend能够基本满足你的需要,
-
问题内容: 以下代码生成一个带有xticklabels的条形图,每个条形图居中。但是,缩放x轴,更改条形数量或更改条形宽度确实会更改标签的位置。是否存在处理该行为的通用方法? 建议和可行的解决方案: 问题答案: 因此,问题在于您只能致电。这样可以固定标签,但是刻度位置仍由来处理,在更改轴限制时会添加/删除刻度。 因此,您还需要修复刻度位置: 通过调用将替换为引擎盖下的。 然后,您可以将条居中以使其
-
本文向大家介绍jquery获取及设置outerhtml的方法,包括了jquery获取及设置outerhtml的方法的使用技巧和注意事项,需要的朋友参考一下 本文实例讲述了jquery获取及设置outerhtml的方法。分享给大家供大家参考。具体分析如下: 在开发过程中,jQuery.html() 是获取当前节点下的html代码,并不包含当前节点本身的代码,然而我们有时候的确需要,可以通过jQuer