前端 - 能否给图表添加基于数据值计算的平均线横线?
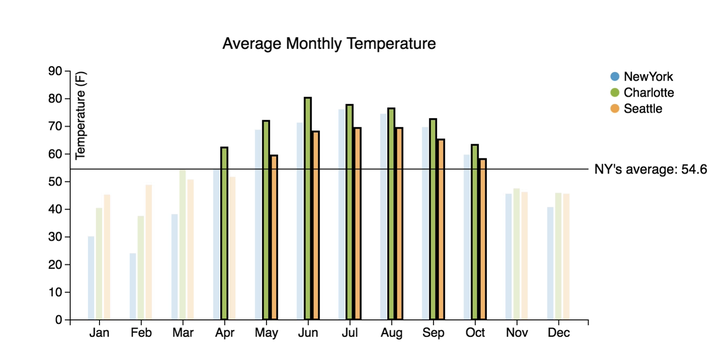
在使用 VChart 图表库时,能否做到类似于下图的效果,在图表中添加标注线表示数据的平均值?

共有3个答案
使用markLine
前提是要:
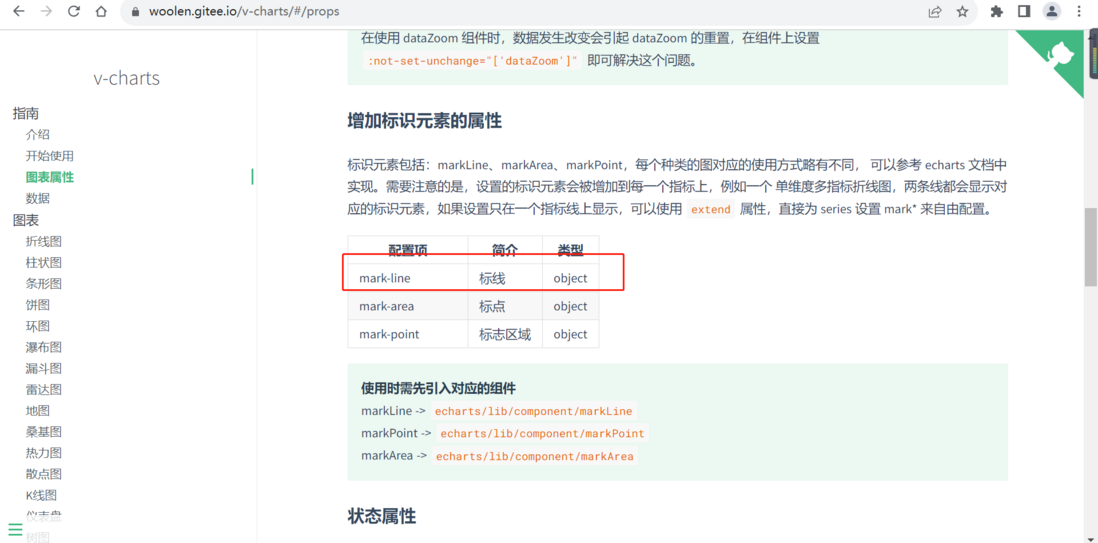
import 'echarts/lib/component/markLine';然后
markLine: { symbol: ['none', 'none'], //去掉两端箭头 label: { //标签 position: 'insideEndTop' }, lineStyle: { type: 'dotted', color: '#663366' }, //设置标线 data: [ { type: 'average' //标线的数据类型 } ] }VChart有着丰富的数据标注能力,对于您描绘的场景,只需要在markLine中配置x: 'average'即可。
const spec = { type: "bar", data: [ { id: "barData", values: [ { type: "Autocracies", year: "1930", value: 129 }, { type: "Autocracies", year: "1940", value: 133 }, { type: "Autocracies", year: "1950", value: 130 }, { type: "Autocracies", year: "1960", value: 126 }, { type: "Autocracies", year: "1970", value: 117 }, { type: "Autocracies", year: "1980", value: 114 }, { type: "Autocracies", year: "1990", value: 111 }, { type: "Autocracies", year: "2000", value: 89 }, { type: "Autocracies", year: "2010", value: 80 }, { type: "Autocracies", year: "2018", value: 80 }, { type: "Democracies", year: "1930", value: 22 }, { type: "Democracies", year: "1940", value: 13 }, { type: "Democracies", year: "1950", value: 25 }, { type: "Democracies", year: "1960", value: 29 }, { type: "Democracies", year: "1970", value: 38 }, { type: "Democracies", year: "1980", value: 41 }, { type: "Democracies", year: "1990", value: 57 }, { type: "Democracies", year: "2000", value: 87 }, { type: "Democracies", year: "2010", value: 98 }, { type: "Democracies", year: "2018", value: 99 } ] } ], xField: ["year", "type"], yField: "value", seriesField: "type", legends: { visible: true, orient: "top", position: "start" }, markLine: [ { y: "average", label: { visible: true, position: "insideEndTop", text: "Average Country", style: { fill: "#000" }, labelBackground: { visible: false } } } ]};在线效果参考:https://codesandbox.io/s/average-markline-wgfdkg

-
我试图使用下面的代码来计算用户输入的一组值的平均值,并将其显示在中,但它不能正常工作。例如,用户输入7、4和5,程序显示1作为平均值,而它应该显示5.3
-
问题内容: 我正在尝试使用下面的代码来计算用户输入的一组值的平均值,并将其显示在中,但它无法正常工作。假设用户输入7、4和5,该程序在应显示5.3时显示平均值。 代码有什么问题? 问题答案: 当您拥有增强的for循环时,为什么还要对索引使用笨拙的for循环?
-
我有一个treemap存储密钥和值,如下所示: 我需要一些帮助来弥补这方面的差距。有没有更好的办法做到这一点?
-
本文向大家介绍awk 根据表格数据计算列中的平均值,包括了awk 根据表格数据计算列中的平均值的使用技巧和注意事项,需要的朋友参考一下 示例 给定一个;用作列定界符的文件。我们使用以下程序在第二列中计算值的平均值,提供的输入是学生组的成绩列表: 该程序的输出为2.125。 请记住,它NR保存了要处理的行数,END因此在块中它保存了文件中的总行数。 请记住,在许多应用程序(监视,统计)中,中位数是更
-
问题内容: 我有下表。我想根据以下公式计算按每个日期分组的加权平均值。我可以使用一些标准的常规代码来执行此操作,但是假设此数据在pandas数据框中,是否有比通过迭代更简单的方法来实现此目的? 2012年1月1日w_avg = 0.5 (60 / sum(60,80,100))+ .75 (80 / sum(60,80,100))+ 1.0 *(100 / sum(60,80,100)) 2012
-
我试图做以下java分配和每件事似乎工作正常,除了当我把一个数字 谢谢 赋值:创建一个询问考试结果并计算成绩平均值的程序。成绩是4到10之间的浮点数。程序要求成绩,直到键入负数。如果用户给出的分数不是4到10之间的数字,则文本“无效成绩!”将在屏幕上打印,程序要求另一个分数。最后,程序在屏幕上打印输入的成绩数及其平均值,如示例打印所示。如果没有输入成绩,通知“您没有输入任何成绩。”是屏幕上唯一打印

