如何重用绘图艺术家(Line2D)?
如何在随后的绘图中重用. field中的绘图行?
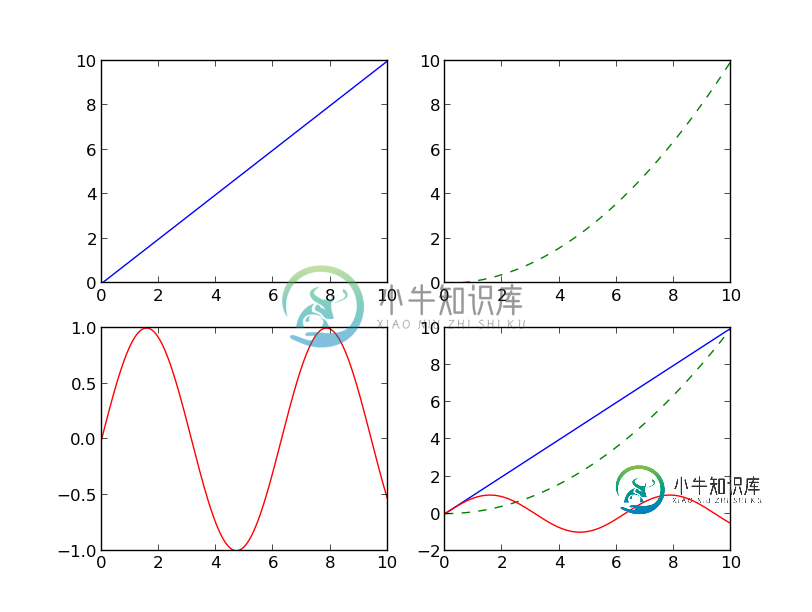
我想在4个轴上绘制图,每个轴上的前三个单独的图,最后一个轴上的所有3个图。代码如下:
from numpy import *
from matplotlib.pyplot import *
fig=figure()
data=arange(0,10,0.01)
ax1=fig.add_subplot(2,2,1)
ax2=fig.add_subplot(2,2,2)
ax3=fig.add_subplot(2,2,3)
ax4=fig.add_subplot(2,2,4)

line1=ax1.plot(data,data)
line2=ax2.plot(data, data**2/10, ls='--', color='green')
line3=ax3.plot(data, np.sin(data), color='red')
#could I somehow use previous plots, instead recreating them all?
line4=ax4.plot(data,data)
line4=ax4.plot(data, data**2/10, ls='--', color='green')
line4=ax4.plot(data, np.sin(data), color='red')
show()

#this is just an example, implementation can be different
line1=plot(data, data)
line2=plot(data, data**2/10, ls='--', color='green')
line3=plot(data, np.sin(data), color='red')
line4=[line1, line2, line3]
现在打印ax1上的线1、ax2上的线2、ax3上的线3和ax4上的线4。
共有3个答案
我在jupyter笔记本中有一个更简单的用例。假设您已经在某个地方存储了一个地物对象,那么如何重新打印它呢。如:
单元1:
f = plt.figure(figsize=(18, 6))
f.suptitle("Hierarchical Clustring", fontsize=20)
dendrogram(Z, color_threshold=cut_off,
           truncate_mode='lastp',
           p=20)
牢房2:
#plot f again, the answer is really simple
f
plt.show()
就这样了。这样做的好处是,您可以将数字存储在对象中,然后在必要时使用它们。
我认为你的用法很好,但是你可以像这样将所有的x,y数据对传递给plot(尽管它让阅读变得非常可怕!):
ax4.plot(data, data, data, data**2 / 10, data, np.sin(data))
另一种有趣的方式是:
graph_data = [(data, data), (data, data**2 / 10), (data, np.sin(data))]
[ax4.plot(i,j) for i,j in graph_data]
- OP中请求的实现不起作用,因为
plt返回了。按照Line2D绘图艺术家。无法重复使用绘图def set\u图(self,fig):
import numpy as np
from copy import copy
import matplotlib.pyplot as plt
from matplotlib.lines import Line2D

# crate the figure and subplots
fig, axes = plt.subplots(2, 2)

# flatten axes into 1-D for easy indexing and iteration
axes = axes.ravel()

# test data
data=np.arange(0, 10, 0.01)

# create test lines
line1 = Line2D(data, data)
line2 = Line2D(data, data**2/10, ls='--', color='green')
line3 = Line2D(data, np.sin(data), color='red')
lines = [line1, line2, line3]

# add the copies of the lines to the first 3 subplots
for ax, line in zip(axes[0:-1], lines):
    ax.add_line(copy(line))

# add 3 lines to the 4th subplot
for line in lines:
    axes[3].add_line(line)

# autoscale all the subplots if needed
for _a in axes:
    _a.autoscale()

plt.show()
- 这里有一个可能的解决方案。我不确定它是否非常漂亮,但至少它不需要代码重复。
import numpy as np, copy
import matplotlib.pyplot as plt, matplotlib.lines as ml

fig=plt.figure(1)
data=np.arange(0,10,0.01)
ax1=fig.add_subplot(2,2,1)
ax2=fig.add_subplot(2,2,2)
ax3=fig.add_subplot(2,2,3)
ax4=fig.add_subplot(2,2,4)

#create the lines
line1=ml.Line2D(data,data)
line2=ml.Line2D(data,data**2/10,ls='--',color='green')
line3=ml.Line2D(data,np.sin(data),color='red')
#add the copies of the lines to the first 3 panels
ax1.add_line(copy.copy(line1))
ax2.add_line(copy.copy(line2))
ax3.add_line(copy.copy(line3))

[ax4.add_line(_l) for _l in [line1,line2,line3]] # add 3 lines to the 4th panel

[_a.autoscale() for _a in [ax1,ax2,ax3,ax4]] # autoscale if needed
plt.draw()
-
原文:Artist tutorial matplotlib API 有三个层级。 matplotlib.backend_bases.FigureCanvas是绘制图形的区域,matplotlib.backend_bases.Renderer是知道如何在ChartCanvas上绘制的对象,而matplotlib.artist.Artist是知道如何使用渲染器在画布上画图的对象。 FigureCanv
-
我可以通过调用这个网址查看Spotify上的所有曲目: http://ws.spotify.com/search/1/track.json?q=xxx 示例响应包含每个曲目的艺术家数据,如: 从上面的响应中,我得到了艺术家ID:38IfmizrHTCxFjd8UKhWnp。 现在,有没有一种方法可以通过api调用获得上述艺术家(38IfmizrHTCxFjd8UKhWnp)的所有曲目? 我想做的是
-
我想找一位艺术家和他们的专辑。所以读这一页https://musicbrainz.org/doc/Development/XML_Web_Service/Version_2 我创建了以下查询以获取Michael Jackson的专辑 我的理解是在URL末尾添加,该URL应返回迈克尔·杰克逊的专辑,但这似乎没有返回正确的结果,或者我无法缩小结果范围?然后我想使用,但是在美术师查询中没有返回(这就是为
-
你好,我想做一个android音乐应用程序,我想我的listView显示所有歌曲,以显示该歌曲的专辑艺术,艺术家姓名,持续时间和歌曲名称 我已经成功显示列表视图中的所有歌曲,但无法显示专辑艺术等 有人能帮我吗?? 提前谢谢
-
最初的计划是把这写成一篇博客文章,标题是“Spotify元数据应用编程接口的低效:或者,杰克逊5是如何杀死我的浏览器的”,但在最后一刻改变了主意,因为我有一个习惯,就是错过留档中显而易见的东西,也许是一个未记录的功能可能存在,我错过了,或者其他人已经解决了这个问题-因此这个问题有一定的博客帖子语气! 我正在开发一个小型网络应用程序,主要是为一小群人开发的,它允许任何人更新Spotify播放列表。因
-
我是Spotify API的新手。我正在试图弄清楚如何搜索一个艺术家和一个标题在同一时间。 我正在使用一个AJAX调用,同时带有艺术家和标题。如果任何一个是空白的,我可以简单地搜索另一个,但我似乎无法弄清楚如何搜索艺术家和标题在同一时间。这样做的目的是缩小结果以找到特定的轨迹。 以下是我的资料: 如前所述,如果我只搜索艺术家或标题,它就可以正常工作。我只是不知道如何使用Spotify的API同时搜

