
如何在谷歌地图中通过连接外部点创建多边形

我正试图创建一个餐厅的多个多边形的基础上,他们的送货费用的数据,我在这里https://jsoneditoronline.org/?id=7a7287f99c0964ffd6125b4bb48a2e50
这是我已经有的https://codepen.io/mani619cash/pen/mpaqQq?editors=1000
它基于文本区域中显示的输入数据创建类似的东西
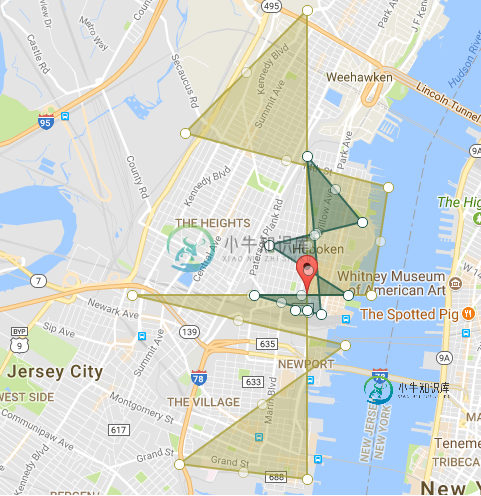
我想要的是类似于下图的东西,将外部图像连接起来生成一个多边形。
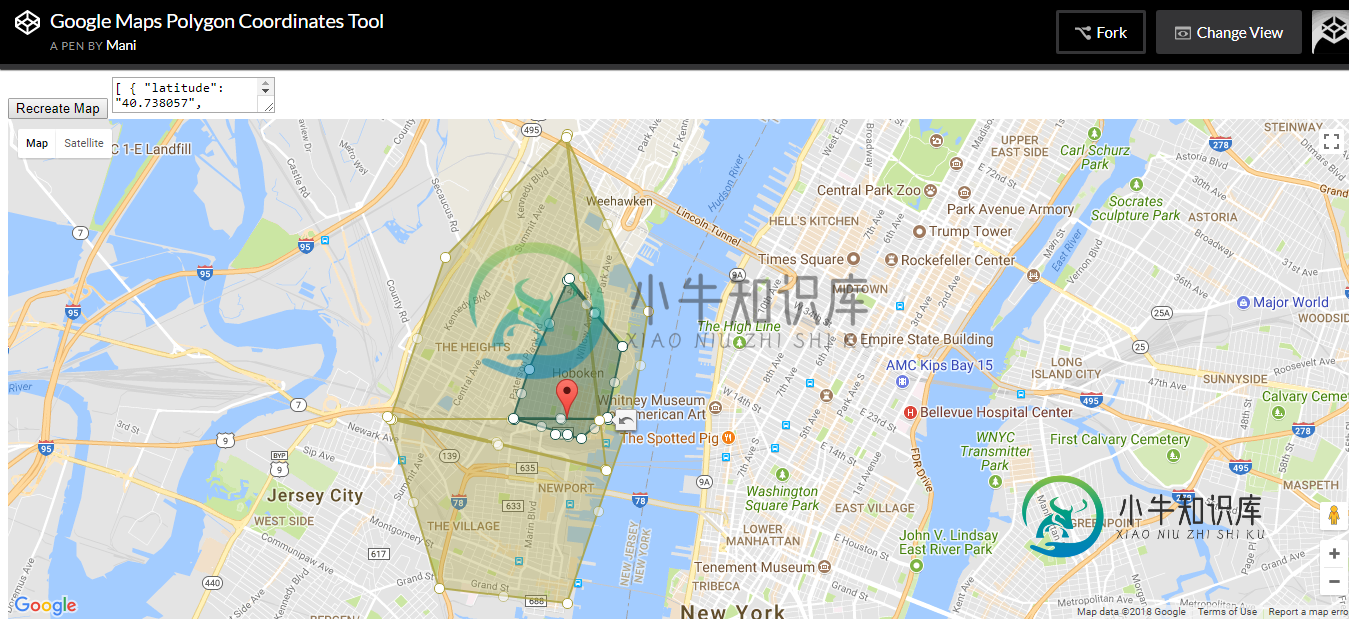
目前,我试图按lat,lon对每个多边形中的数据进行排序,但多边形仍然混乱
共有1个答案

从中心按方位对坐标进行排序(仅适用于简单多边形)。从我对这个问题的一个回答:OSM到谷歌地图
排序功能:
function sortFunc(a, b) {
  var bearA = google.maps.geometry.spherical.computeHeading(centerPt, a);
  var bearB = google.maps.geometry.spherical.computeHeading(centerPt, b);
  console.log(bearA + ":" + bearB);
  return (bearA - bearB);
}
对顶点进行排序的代码:
var bounds = new google.maps.LatLngBounds();
for (direction in data_json[hotel]['polygon'][region]) {
  var temp = new google.maps.LatLng(data_json[hotel]['polygon'][region][direction]['lat'], data_json[hotel]['polygon'][region][direction]['lon'])
  triangleCoords.push(temp);
  bounds.extend(temp);
}
// sort coordinates
centerPt = bounds.getCenter();
triangleCoords = triangleCoords.sort(sortFunc);

// Styling & Controls
myPolygon = new google.maps.Polygon({
  paths: triangleCoords,
  draggable: true, // turn off if it gets annoying
  editable: true,
  strokeColor: color_of_this,
  strokeOpacity: 0.8,
  strokeWeight: 2,
  fillColor: color_of_this,
  fillOpacity: 0.35
});
概念证明小提琴
代码段:
function initialize() {
  var data_json = $("#info").val();
  data_json = JSON.parse(data_json);
  var myLatLng = new google.maps.LatLng(data_json[0]['latitude'], data_json[0]['longitude']);
  var mapOptions = {
    zoom: 13,
    center: myLatLng,
    mapTypeId: google.maps.MapTypeId.RoadMap
  };
  var map = new google.maps.Map(document.getElementById('map-canvas'), mapOptions);
  for (hotel in data_json) {
    for (region in data_json[hotel]['polygon']) {
      var triangleCoords = [];
      var color_of_this = "#" + ((1 << 24) * Math.random() | 0).toString(16);
      var bounds = new google.maps.LatLngBounds();
      for (direction in data_json[hotel]['polygon'][region]) {
        var temp = new google.maps.LatLng(data_json[hotel]['polygon'][region][direction]['lat'], data_json[hotel]['polygon'][region][direction]['lon'])
        triangleCoords.push(temp);
        bounds.extend(temp);
      }
      // sort coordinates
      centerPt = bounds.getCenter();
      triangleCoords = triangleCoords.sort(sortFunc);

      // Styling & Controls
      myPolygon = new google.maps.Polygon({
        paths: triangleCoords,
        draggable: true, // turn off if it gets annoying
        editable: true,
        strokeColor: color_of_this,
        strokeOpacity: 0.8,
        strokeWeight: 2,
        fillColor: color_of_this,
        fillOpacity: 0.35
      });
      myPolygon.setMap(map);
      new google.maps.Marker({
        position: myLatLng,
        map: map
      });
    }
    map.fitBounds(bounds);
  }
}

function sortFunc(a, b) {
  var bearA = google.maps.geometry.spherical.computeHeading(centerPt, a);
  var bearB = google.maps.geometry.spherical.computeHeading(centerPt, b);
  return (bearA - bearB);
}
//Display Coordinates below map
function getPolygonCoords() {
  var len = myPolygon.getPath().getLength();
  var htmlStr = "";
  for (var i = 0; i < len; i++) {
    htmlStr += "new google.maps.LatLng(" + myPolygon.getPath().getAt(i).toUrlValue(5) + "), ";
  }
}
google.maps.event.addDomListener(window, "load", initialize);
html,
body,
#map-canvas {
height: 100%;
width: 100%;
margin: 0px;
padding: 0px
}<script src="https://ajax.googleapis.com/ajax/libs/jquery/2.1.1/jquery.min.js"></script>
<script src="https://maps.googleapis.com/maps/api/js?libraries=geometry"></script>
<div id="map-canvas"></div>
<textarea id="info">[ { "latitude": "40.738057", "polygon": { "0": { "direction6": { "lat": 40.756056999999956, "delivery_estimate": 45, "lon": -74.034318, "delivery_fee": 200, "delivery_offered_to_diner_location": true }, "direction2": { "lat": 40.74755700000004, "delivery_estimate":
45, "lon": -74.02481799999995, "delivery_fee": 200, "delivery_offered_to_diner_location": true }, "direction7": { "lat": 40.74455700000003, "delivery_estimate": 45, "lon": -74.04081800000003, "delivery_fee": 200, "delivery_offered_to_diner_location":
true }, "direction3": { "lat": 40.738057, "delivery_estimate": 45, "lon": -74.02731799999997, "delivery_fee": 200, "delivery_offered_to_diner_location": true }, "direction4": { "lat": 40.738057, "delivery_estimate": 45, "lon": -74.04331800000004, "delivery_fee":
200, "delivery_offered_to_diner_location": true }, "direction5": { "lat": 40.736057, "delivery_estimate": 45, "lon": -74.034318, "delivery_fee": 200, "delivery_offered_to_diner_location": true }, "direction1": { "lat": 40.73605699999999, "delivery_estimate":
45, "lon": -74.03631800000001, "delivery_fee": 200, "delivery_offered_to_diner_location": true }, "direction8": { "lat": 40.735556999999986, "delivery_estimate": 45, "lon": -74.03181799999999, "delivery_fee": 200, "delivery_offered_to_diner_location":
true } }, "1": { "direction6": { "lat": 40.77505699999991, "delivery_estimate": 45, "lon": -74.034318, "delivery_fee": 500, "delivery_offered_to_diner_location": false }, "direction7": { "lat": 40.7590570000001, "delivery_estimate": 45, "lon": -74.0553180000001,
"delivery_fee": 500, "delivery_offered_to_diner_location": false }, "direction2": { "lat": 40.752057000000065, "delivery_estimate": 45, "lon": -74.02031799999993, "delivery_fee": 500, "delivery_offered_to_diner_location": false }, "direction3": { "lat":
40.738057, "delivery_estimate": 45, "lon": -74.02331799999995, "delivery_fee": 500, "delivery_offered_to_diner_location": false }, "direction4": { "lat": 40.738057, "delivery_estimate": 45, "lon": -74.06431800000014, "delivery_fee": 500, "delivery_offered_to_diner_location":
false }, "direction8": { "lat": 40.73155699999997, "delivery_estimate": 45, "lon": -74.02781799999997, "delivery_fee": 500, "delivery_offered_to_diner_location": false }, "direction1": { "lat": 40.71605699999989, "delivery_estimate": 45, "lon": -74.0563180000001,
"delivery_fee": 500, "delivery_offered_to_diner_location": false }, "direction5": { "lat": 40.714057000000054, "delivery_estimate": 45, "lon": -74.034318, "delivery_fee": 500, "delivery_offered_to_diner_location": false } } }, "id": "287478", "longitude":
"-74.034318", "name": "Tony Boloney's" } ]</textarea>-
我对类似的http://wiki.openstreetmap.org/wiki/Nominatim 即,为了能够提出请求并获得某种多边形坐标: “geojson:{“类型”:“多边形”,“坐标”:[[[-87.464761,44.600998],-87.459755,44.599569],-87.459745,44.601012],-87.463143,44.601],-87.464761,44.
-
我想实现喜欢用户可以从我们的应用程序在谷歌地图绘制一个区域。然后当他回来的时候,然后应该加载他/她以前画的数据。 我用了两种方法。一是,, > 使用javascript在googlemap中绘制多边形 https://developers.google.com/maps/documentation/javascript/drawinglayer 使用谷歌地图api数据层<代码>http://jsf
-
我想用多边形类和一组lat/lng坐标在谷歌地图上画一个城区区域。 OpenStreetMap为我提供了所需的所有数据——如果我键入一些地区名称,我可以获得OSM XML格式的有用数据,例如拉脱维亚里加“Vecmilgravis”地区的OSM绘制多边形,以及OSM XML格式的数据。 问题是所有这些节点都是按某种奇怪的顺序排序的,因此如果我只提取所有和对,并为Google Maps多边形类创建一个
-
我想用谷歌地图建立一个多边形区域作为图片,你可以知道如何获得该区域的坐标数组? 所需多边形的图片
-
我想创建一个谷歌地图标记列表,这些标记填充关于这些特定位置的信息窗口,并在信息窗口内链接到维基百科关于该位置的文章。我在这个单击函数中进行Ajax调用,并且这个函数在一个
-
在互联网上我可以找到许多创建谷歌地图的例子。 这样地:https://developers.google.com/maps/documentation/javascript/examples/polygon-arrays 但是我需要创建多边形不是从拉特和Lng,而是公里。 示例: 有可能吗?