xtick格式与matplotlib-每周数据每年显示一次
我希望有办法解决这个问题,因为关于pyplot中的xtick格式有很多问题,但我没有发现任何与这个问题相关的东西。
我有以下代码:
fig, ax=plt.subplots(1,1,figsize=[10, 5]) # Set dimensions for figure
plt.plot(organic_search.groupby('week-year').Amount.sum(), color='g')
plt.title('Organic Search Revenue Time Series')
fmt = '${x:,.0f}'
tick = mtick.StrMethodFormatter(fmt)
ax.yaxis.set_major_formatter(tick)
plt.ylabel('Revenue')
plt.xlabel('Week')
plt.grid(True)
plt.show()
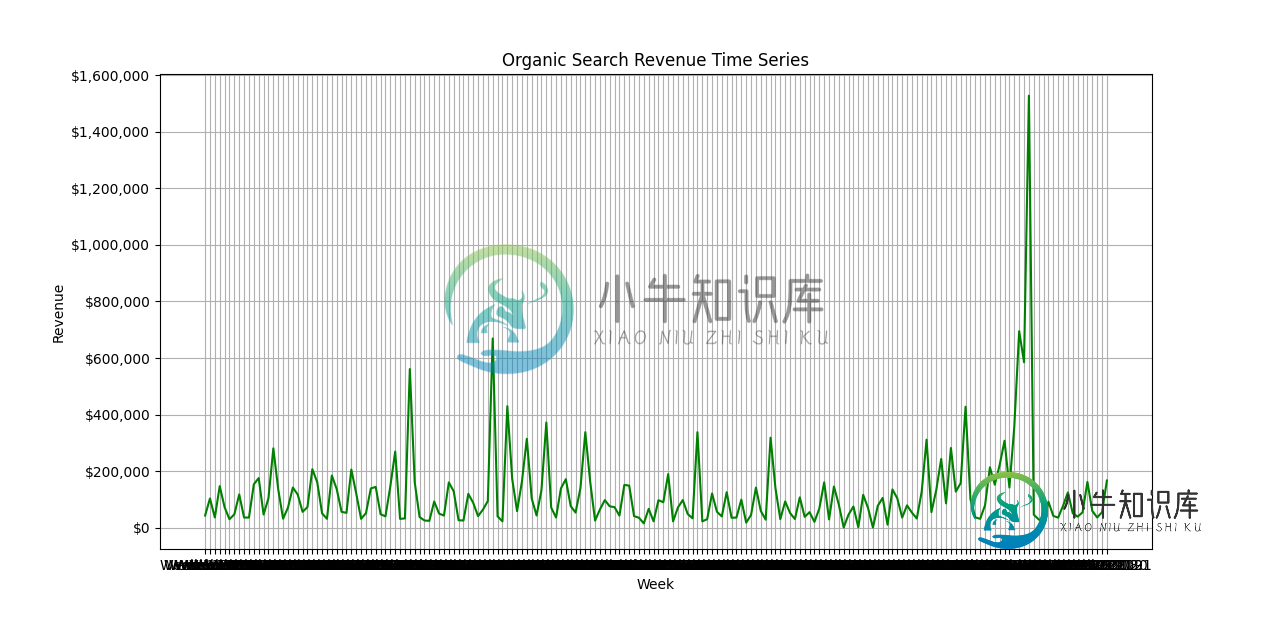
它工作得很好,但是输出有点混乱,因为这是每周的数据。
一些样本数据:
Week | Week_Start_Date |  Amount |  year |     week-year |
Week 1      2018-01-01   42920     2018     Week 1 2018
Week 2      2018-01-08   37772     2018     Week 2 2018
Week 3      2018-01-15   41076     2018     Week 3 2018
Week 4      2018-01-22   38431     2018     Week 4 2018
Week 5      2018-01-29  101676     2018     Week 5 2018
输出:

xticks标签是不可读的,我想知道是否有人知道如何拥有相同的每周图表,但xticks只代表一年。我尝试了几种不同的方法,但是要么(1)它将图形缩小到屏幕的最左边,要么(2)我得到一个错误,说“刻度标签(4)不匹配数据点(186)”。
我只是想要一个更整洁的显示-不是关键的分析,但帮助是感激的
共有1个答案
- 问题是x轴,
'week-year'是字符串类型。- 查看将字符串数据传递到matplotlib API时打印的内容?详细解释向API传递字符串时发生的情况
- matplotlib:修复常见的日期烦恼
import pandas as pd
import matplotlib.pyplot as plt
import pandas_datareader as web  # for test data; not part of pandas

# load 1 year of sample data
df = web.DataReader('amzn', data_source='yahoo', start='2020-01-01', end='2021-01-01').reset_index()

# display(df.head())
        Date     High      Low    Open    Close   Volume  Adj Close
0 2020-01-02  1898.01  1864.15  1875.0  1898.01  4029000    1898.01
1 2020-01-03  1886.20  1864.50  1864.5  1874.97  3764400    1874.97

# if the 'Date' column or a date index is not a datetime dtype then convert it
# df.index = pd.to_datetime(df.index)
df.Date = pd.to_datetime(df.Date)

# set the Date column as the index, if it isn't already there
df = df.set_index('Date')

# resample to a Weekly beginning on Monday; .sum() can be used, .mean() is correct for this sample data
dfr = df.resample('W-MON').mean()

# display(dfr.head())
               High      Low     Open    Close      Volume  Adj Close
Date
2020-01-06  1895.97  1862.88  1866.50  1891.95  3951733.33    1891.95
2020-01-13  1909.53  1887.02  1901.82  1894.87  3270940.00    1894.87

# plot; plot a single column with y='High'
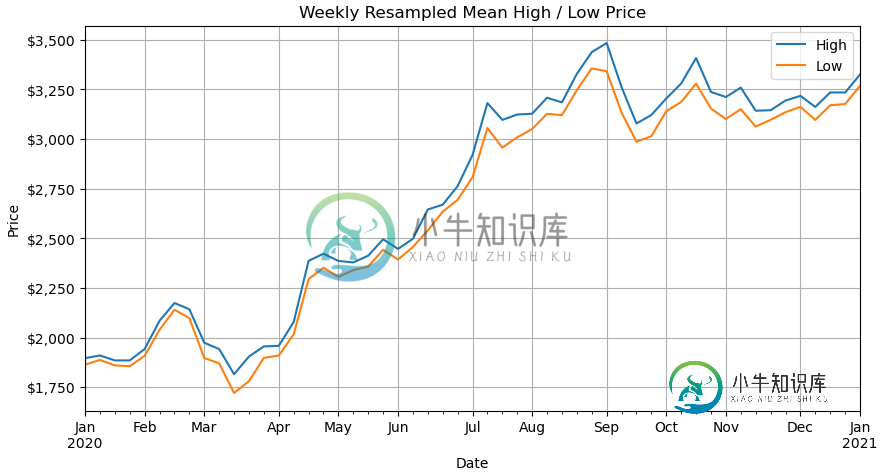
ax = dfr.plot(y=['High', 'Low'], figsize=(10, 5), grid=True, title='Weekly Resampled Mean High / Low Price', ylabel='Price')
ax.yaxis.set_major_formatter('${x:,.0f}')
plt.show()
-
问题内容: 因此,我有一个图形,它以10000个时间步长的数量级运行,因此我有很多数据点,并且xtick之间的距离很远,这很酷,但是我想在xaxis上显示该点绘制数据时的位置。在这种情况下,我要显示的xtick是271。因此,如果我已经知道要显示的刻度,是否有办法将271刻度自动插入到x轴上? 问题答案: 如果在平移/放大时更新刻度线并不重要(即,如果绘图不适合交互式使用),则可以使用该方法手动设
-
问题内容: 我当前正在将日志从Nlog发送到ElasticSearch。我每天创建索引,并将日志发送到该索引。我想创建每周索引,所以我想更改配置文件。 我在NLog配置文件中创建索引。 我的NLog配置部分: 我在一些论坛(https://github.com/logstash-plugins/logstash-output- elasticsearch/issues/541#issuecomme
-
我有一个时间序列,列出了几个月交易历史中期货合约的成交价格数据。我希望有一个图表(折线图),显示时间序列中最近4周内每周滴答数据的交易历史(该序列不断更新) X轴将显示周一至周五的日期,图表上任何时候都会有4条单独的线详细说明刻度数据。我已经设法做到这一点,使用一些代码,绘制最后一笔交易的每一天,但我需要的是滴答数据绘图,而不是仅仅一个数据点,每天为每一行。 这是一张Excel图表(!)在我试图用
-
问题内容: 我每年进行一次嵌套聚合,然后每年在Elasticsearch中进行每周一次嵌套聚合。years年有53周,但是ElasticSearch的结果给出的是year年的最后一周key =“ 1”而不是“ 53”。如何让ElasticSearch在上周返回53而不是1? 这是我的查询: 结果(删除的数据在中间): 2008年是a年,最后一个星期有“ key_as_string”:“ 1”。我希
-
我必须将数据帧从当前格式转换为新格式(见下图或结构)。我不知道我怎样才能做到这一点。我希望每个ID有一年,从2013年到2018年(因此每个ID有6行,每年一行)。日期是居住在该地址的日期(进入日期)和离开该地址的日期(结束日期)。因此,每个ID和年份都给出了他们居住的zipcode和城市。ID(每年)居住的地方应该是他们在那一年居住的时间最长的地方。我已经将截止日期设置为2018年12月31日,
-
我需要每隔周一和周三触发我的邮件。我在我的应用程序中使用JavaSpring。我尝试使用这个cron表达式和周三相同,但它在每月的1个周一和周三触发。我想要的是它应该在每月的第一、第三和第五周的周一和周三触发。 有人能帮我创建这个cron表达式吗?

