
在JFreeChart中制作自定义环图

我目前正在使用itext-pdf生成PDF。除此之外,我还使用JFreeChart在上面创建图表。我已经创建了一个爆炸效果的甜甜圈图表,它看起来像这样。

然而,我想创建一个甜甜圈图,看起来更像这样。
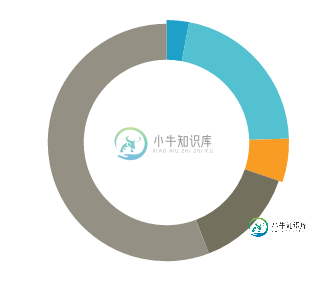
我想让某些部分脱颖而出,但不要完全从甜甜圈图表中分离出来。我非常感谢关于如何实现这一目标的投入。
import java.awt.Color;
import java.awt.Graphics2D;
import java.awt.geom.Rectangle2D;
import java.io.FileOutputStream;
import java.io.IOException;
import java.text.DecimalFormat;
import java.util.Locale;

import org.jfree.chart.ChartFactory;
import org.jfree.chart.JFreeChart;
import org.jfree.chart.labels.StandardPieSectionLabelGenerator;
import org.jfree.chart.plot.PiePlotState;
import org.jfree.chart.plot.RingPlot;
import org.jfree.data.general.DefaultPieDataset;
import org.jfree.ui.RectangleInsets;


import com.itextpdf.awt.DefaultFontMapper;
import com.itextpdf.text.BaseColor;
import com.itextpdf.text.Document;
import com.itextpdf.text.DocumentException;
import com.itextpdf.text.Element;
import com.itextpdf.text.Font;
import com.itextpdf.text.PageSize;
import com.itextpdf.text.Phrase;
import com.itextpdf.text.pdf.BaseFont;
import com.itextpdf.text.pdf.ColumnText;
import com.itextpdf.text.pdf.PdfContentByte;
import com.itextpdf.text.pdf.PdfTemplate;
import com.itextpdf.text.pdf.PdfWriter;

public class RingChartTest {
    public static void main(String[] args) throws Exception {
        new RingChartTest().createPDF();
    }

    private void createPDF() throws Exception {
        String destination = "ringchart.pdf";

        Document document = new Document(PageSize.A4.rotate());
        try {
            PdfWriter writer = PdfWriter.getInstance(document, new FileOutputStream(destination));
            document.open();

            // Create the pages
            PdfContentByte cb = writer.getDirectContent();
            addChart(cb);
        } catch (Exception e) {
            System.out.println("Failure to generate the PDF");
            e.printStackTrace();
        } finally {
            if (document != null) {
                document.close();
            }
        }
    }

    private void addChart(PdfContentByte cb) throws Exception, IOException {
        long pctPM = Math.round(20);
        long pctOA = Math.round(15);
        long pctWPI = Math.round(5);
        long pctTDF = Math.round(25);
        long pctNE = 100 - (pctPM + pctOA + pctWPI + pctTDF);
        long pctEngaged = pctPM + pctOA + pctWPI;
        long numEngaged = 3400;
        String strNumEngaged = formatNumber(numEngaged, "#,###,###,##0");


        JFreeChart chart = createChart(pctPM, pctOA, pctWPI, pctTDF, pctNE);

        int width = 300;
        int height = 200;
        PdfTemplate template = cb.createTemplate(width, height);
        Graphics2D graphics2d = template.createGraphics(width, height, new DefaultFontMapper());
        Rectangle2D rectangle2d = new Rectangle2D.Double(0, 0, width, height);
        chart.draw(graphics2d, rectangle2d);
        graphics2d.dispose();
        cb.addTemplate(template, 30, 185);

        // Add text inside chart
        Font engagementFont = createFont("OpenSans-Bold.ttf", 8, 116, 112, 100);
        Font percentFont1 = createFont("OpenSans-Light.ttf", 22, 116, 112, 100);
        Font percentFont2 = createFont("OpenSans-Light.ttf", 10, 116, 112, 100);
        Font numberFont = createFont("OpenSans-Regular.ttf", 8, 116, 112, 100);
        addPhrase(cb, "ENGAGE", engagementFont, 135, 290, 230, 310, 10, Element.ALIGN_CENTER);
        addPhrase(cb, String.valueOf(pctEngaged), percentFont1, 115, 270, 190, 289, 10, Element.ALIGN_RIGHT);
        addPhrase(cb, "%", percentFont2, 191, 275, 201, 299, 10, Element.ALIGN_LEFT);
        addPhrase(cb, "(" + strNumEngaged + ")", numberFont, 130, 258, 230, 278, 10, Element.ALIGN_CENTER);

        // Create legend
        // 290,420,370,520,10,Element.ALIGN_CENTER);
        BaseFont engagedPctFont = createBaseFont("OpenSans-Bold.ttf");
        BaseFont engagedDescFont = createBaseFont("OpenSans-SemiBold.ttf");
        BaseFont nonEngagedDescFont = createBaseFont("OpenSans-Regular.ttf");
        BaseColor pmBaseColor = new BaseColor(31, 160, 200);
        BaseColor oaBaseColor = new BaseColor(84, 193, 209);
        BaseColor wpiBaseColor = new BaseColor(248, 156, 36);
        BaseColor tdfBaseColor = new BaseColor(116, 112, 94);
        BaseColor nonEngagedBaseColor = new BaseColor(148, 144, 132);
        float x = 330;
        float y = 350;
        float radius = 3;

        // Create border around legend
        /*
        cb.setColorFill(new BaseColor(255, 255, 255));
        cb.rectangle(320, 300, 150, 70);
        cb.re
        cb.fill();
        */
        BaseColor borderColor = new BaseColor(192, 189, 178);
        cb.setColorStroke(borderColor);
        cb.moveTo(320, 300);
        cb.lineTo(320, 365);
        cb.lineTo(500, 365);
        cb.lineTo(500, 300);
        cb.lineTo(320, 300);
        cb.closePathStroke();

        // Prof Mgmt
        cb.setColorFill(pmBaseColor);
        cb.circle(x, y, radius);
        cb.fill();
        addTextToCanvas(cb, pctPM+"%", engagedPctFont, 8, new BaseColor(116, 112, 100), x+20, y-2);
        addTextToCanvas(cb, "Pg", engagedDescFont, 8, new BaseColor(116, 112, 100), x+50, y-2);
        // Online Advice
        cb.setColorFill(oaBaseColor);
        cb.circle(x, y-20, radius);
        cb.fill();
        addTextToCanvas(cb, pctOA+"%", engagedPctFont, 8, new BaseColor(116, 112, 100), x+20, y-22);
        addTextToCanvas(cb, "Oaa", engagedDescFont, 8, new BaseColor(116, 112, 100), x+50, y-22);
        // Clicked WPI/Online Guidance
        cb.setColorFill(wpiBaseColor);
        cb.circle(x, y-40, radius);
        cb.fill();
        addTextToCanvas(cb, pctWPI+"%", engagedPctFont, 8, new BaseColor(116, 112, 100), x+20, y-42);
        addTextToCanvas(cb, "Ogg", engagedDescFont, 8, new BaseColor(116, 112, 100), x+50, y-42);
        if (pctTDF > 0) {
            // TDF Users
            cb.setColorFill(tdfBaseColor);
            cb.circle(x, y-60, radius);
            cb.fill();
            addTextToCanvas(cb, pctTDF+"%", engagedPctFont, 8, new BaseColor(116, 112, 100), x+20, y-62);
            addTextToCanvas(cb, "Pti*", nonEngagedDescFont, 8, new BaseColor(116, 112, 100), x+50, y-62);
            // Non-engaged
            cb.setColorFill(nonEngagedBaseColor);
            cb.circle(x, y-80, radius);
            cb.fill();
            addTextToCanvas(cb, pctNE+"%", engagedPctFont, 8, new BaseColor(116, 112, 100), x+20, y-82);
            addTextToCanvas(cb, "Nng", nonEngagedDescFont, 8, new BaseColor(116, 112, 100), x+50, y-82);
        } else {
            // Non-engaged
            cb.setColorFill(nonEngagedBaseColor);
            cb.circle(x, y-60, radius);
            cb.fill();
            addTextToCanvas(cb, pctNE+"%", engagedPctFont, 8, new BaseColor(116, 112, 100), x+20, y-62);
            addTextToCanvas(cb, "ngd", nonEngagedDescFont, 8, new BaseColor(116, 112, 100), x+50, y-62);
        }
    }

    private String formatNumber(double value, String strFormat) {
        DecimalFormat df = new DecimalFormat( strFormat );
        return df.format(value);
    }

    private void addPhrase(PdfContentByte cb, String strText, Font font, float llx, float lly, float urx, float ury, float leading, int alignment) throws DocumentException {
        Phrase phrase = new Phrase(strText, font);
        ColumnText ct = new ColumnText(cb);
        ct.setSimpleColumn(phrase, llx, lly, urx, ury, leading, alignment);
        ct.go();
    }

    private void addTextToCanvas(PdfContentByte cb, String strText, BaseFont font, float fontSize, BaseColor color, float x, float y) {
        cb.beginText();
        cb.setFontAndSize(font, fontSize);
        cb.setColorFill(color);
        cb.showTextAligned(Element.ALIGN_LEFT, strText, x, y, 0);
        cb.endText();
    }

    private BaseFont createBaseFont(String fileName) throws DocumentException, IOException {
        return BaseFont.createFont(PdfGenerationController.LOCATION_FONTS + fileName ,BaseFont.IDENTITY_H, BaseFont.EMBEDDED);
    }

    private Font createFont(String fileName, float size, int red, int green, int blue) throws DocumentException, IOException {
        BaseFont baseFont = BaseFont.createFont(PdfGenerationController.LOCATION_FONTS + fileName ,BaseFont.IDENTITY_H, BaseFont.EMBEDDED);
        Font font = new Font(baseFont, size);
        font.setColor(red, green, blue);
        return font;
    }

    public JFreeChart createChart(long pctPM, long pctOA, long pctWPI, long pctTDF, long pctNE) {
        // Set up the data set for the donut/ring chart
        DefaultPieDataset rDataSet =  new DefaultPieDataset();
        rDataSet.setValue("PM", pctPM );
        rDataSet.setValue("OA", pctOA);
        rDataSet.setValue("WPI", pctWPI);
        rDataSet.setValue("TDF", pctTDF);
        rDataSet.setValue("NE", pctNE);

        // Initialize values
        boolean bShowLegend = false;
        String strTitle = null;

        // Create ring plot
        CustomDonutPlot rPlot = new CustomDonutPlot(rDataSet);
        //RingPlot rPlot = new RingPlot(rDataSet);
        rPlot.setLabelGenerator(new StandardPieSectionLabelGenerator(Locale.ENGLISH));
        rPlot.setInsets(new RectangleInsets(0.0, 5.0, 5.0, 5.0));
        rPlot.setSectionDepth(0.30);
        JFreeChart chart = new JFreeChart(strTitle, JFreeChart.DEFAULT_TITLE_FONT, rPlot, bShowLegend);
        ChartFactory.getChartTheme().apply(chart);

        // Create the chart
        //JFreeChart rChart = ChartFactory.createRingChart(null, rDataSet , false, false, Locale.ENGLISH);
        //RingPlot rPlot = (RingPlot) rChart.getPlot();
        rPlot.setBackgroundPaint(Color.WHITE);
        rPlot.setCenterText(null);
        rPlot.setLabelGenerator(null);
        rPlot.setOutlineVisible(false);
        rPlot.setShadowGenerator(null);
        rPlot.setSeparatorsVisible(false);
        rPlot.setShadowPaint(null);
        rPlot.setSectionOutlinesVisible(false);
        rPlot.setOuterSeparatorExtension(0);
        rPlot.setInnerSeparatorExtension(0);

        // Set colors of the chart
        rPlot.setSectionPaint("PM", new Color(31, 160, 200));
        rPlot.setSectionPaint("OA", new Color(84, 193, 209));
        rPlot.setSectionPaint("WPI", new Color(248, 156, 36));
        rPlot.setSectionPaint("TDF", new Color(116, 112, 94));
        rPlot.setSectionPaint("NE", new Color(148, 144, 132));

        rPlot.setExplodePercent("PM", 0.05);
        rPlot.setExplodePercent("OA", 0.05);
        rPlot.setExplodePercent("WPI", 0.05);

        return chart;
    }

    public static class CustomDonutPlot extends RingPlot {
        private static final long serialVersionUID = 1L;

        public CustomDonutPlot(DefaultPieDataset dataSet) {
            super(dataSet);
        }

        @Override
        protected void drawItem(Graphics2D g2, int section, Rectangle2D dataArea, PiePlotState state, int currentPass) {
            if (currentPass == 1 && section >=1 && section <= 3) {

            }
            Rectangle2D area = state.getPieArea();
            System.out.println("*** At section=" + section + ", pass="+currentPass);
            logDataArea(dataArea, "Data area");
            logDataArea(area, "Pie area");
            System.out.println(state.getInfo());

            super.drawItem(g2, section, dataArea, state, currentPass);


        }

        private void logDataArea(Rectangle2D dataArea, String msg) {
            System.out.println(msg + " h="+dataArea.getHeight() + ", w=" + dataArea.getWidth() + ", x=" + dataArea.getX() + ",y="+dataArea.getY());
        }


    }
}
import java.awt.Color;
import java.awt.EventQueue;
import java.awt.Graphics2D;
import java.awt.geom.Rectangle2D;
import java.util.Locale;
import javax.swing.JFrame;
import org.jfree.chart.ChartFactory;
import org.jfree.chart.ChartPanel;
import org.jfree.chart.JFreeChart;
import org.jfree.chart.labels.StandardPieSectionLabelGenerator;
import org.jfree.chart.plot.PiePlotState;
import org.jfree.chart.plot.RingPlot;
import org.jfree.data.general.DefaultPieDataset;
import org.jfree.ui.RectangleInsets;

/**
 * @see http://stackoverflow.com/q/37213030/230513
 */
public class Test {

    private void display() {
        JFrame f = new JFrame("Test");
        f.setDefaultCloseOperation(JFrame.EXIT_ON_CLOSE);
        long pctPM = Math.round(20);
        long pctOA = Math.round(15);
        long pctWPI = Math.round(5);
        long pctTDF = Math.round(25);
        long pctNE = 100 - (pctPM + pctOA + pctWPI + pctTDF);
        f.add(new ChartPanel(createChart(pctPM, pctOA, pctWPI, pctTDF, pctNE)));
        f.pack();
        f.setLocationRelativeTo(null);
        f.setVisible(true);
    }

    public JFreeChart createChart(long pctPM, long pctOA, long pctWPI, long pctTDF, long pctNE) {
        // Set up the data set for the donut/ring chart
        DefaultPieDataset rDataSet = new DefaultPieDataset();
        rDataSet.setValue("PM", pctPM);
        rDataSet.setValue("OA", pctOA);
        rDataSet.setValue("WPI", pctWPI);
        rDataSet.setValue("TDF", pctTDF);
        rDataSet.setValue("NE", pctNE);

        // Initialize values
        boolean bShowLegend = false;
        String strTitle = null;

        // Create ring plot
        CustomDonutPlot rPlot = new CustomDonutPlot(rDataSet);
        //RingPlot rPlot = new RingPlot(rDataSet);
        rPlot.setLabelGenerator(new StandardPieSectionLabelGenerator(Locale.ENGLISH));
        rPlot.setInsets(new RectangleInsets(0.0, 5.0, 5.0, 5.0));
        rPlot.setSectionDepth(0.30);
        JFreeChart chart = new JFreeChart(strTitle, JFreeChart.DEFAULT_TITLE_FONT, rPlot, bShowLegend);
        ChartFactory.getChartTheme().apply(chart);

        // Create the chart
        //JFreeChart rChart = ChartFactory.createRingChart(null, rDataSet , false, false, Locale.ENGLISH);
        //RingPlot rPlot = (RingPlot) rChart.getPlot();
        rPlot.setBackgroundPaint(Color.WHITE);
        rPlot.setCenterText(null);
        rPlot.setLabelGenerator(null);
        rPlot.setOutlineVisible(false);
        rPlot.setShadowGenerator(null);
        rPlot.setSeparatorsVisible(false);
        rPlot.setShadowPaint(null);
        rPlot.setSectionOutlinesVisible(false);
        rPlot.setOuterSeparatorExtension(0);
        rPlot.setInnerSeparatorExtension(0);

        // Set colors of the chart
        rPlot.setSectionPaint("PM", new Color(31, 160, 200));
        rPlot.setSectionPaint("OA", new Color(84, 193, 209));
        rPlot.setSectionPaint("WPI", new Color(248, 156, 36));
        rPlot.setSectionPaint("TDF", new Color(116, 112, 94));
        rPlot.setSectionPaint("NE", new Color(148, 144, 132));

        rPlot.setExplodePercent("PM", 0.05);
        rPlot.setExplodePercent("OA", 0.05);
        rPlot.setExplodePercent("WPI", 0.05);

        return chart;
    }

    public static class CustomDonutPlot extends RingPlot {

        private static final long serialVersionUID = 1L;

        public CustomDonutPlot(DefaultPieDataset dataSet) {
            super(dataSet);
        }

        @Override
        protected void drawItem(Graphics2D g2, int section, Rectangle2D dataArea, PiePlotState state, int currentPass) {
            super.drawItem(g2, section, dataArea, state, currentPass);
            Rectangle2D area = state.getPieArea();
            System.out.println("*** At section=" + section + ", pass=" + currentPass);
            logDataArea(dataArea, "Data area");
            logDataArea(area, "Pie area");
        }

        private void logDataArea(Rectangle2D dataArea, String msg) {
            System.out.println(msg + " h=" + dataArea.getHeight() + ", w=" + dataArea.getWidth() + ", x=" + dataArea.getX() + ",y=" + dataArea.getY());
        }
    }

    public static void main(String[] args) {
        EventQueue.invokeLater(new Test()::display);
    }
}
共有1个答案

似乎你需要在未爆炸弧的位置画出你的爆炸弧。为此,您可以重写ringplot::GetArcBounds并处理弧的边界。更新代码(内部类)以获得下面的图像:
public static class CustomDonutPlot extends RingPlot {
    private static final long serialVersionUID = 1L;

    public CustomDonutPlot(DefaultPieDataset dataSet) {
        super(dataSet);
    }

    @Override
    protected void drawItem(Graphics2D g2, int section, Rectangle2D dataArea, PiePlotState state, int currentPass) {
        if (currentPass == 1 && section >=1 && section <= 3) {

        }
        Rectangle2D area = state.getPieArea();
        System.out.println("*** At section=" + section + ", pass="+currentPass);
        logDataArea(dataArea, "Data area");
        logDataArea(area, "Pie area");
        System.out.println(state.getInfo());

        super.drawItem(g2, section, dataArea, state, currentPass);


    }
    @Override
    protected Rectangle2D getArcBounds(Rectangle2D unexploded, Rectangle2D exploded, double angle, double extent, double explodePercent) {
        if(explodePercent > 0.0){
            this.setSectionDepth(0.33);//to match inner arc
            java.awt.geom.Arc2D.Double arc1 = new java.awt.geom.Arc2D.Double(unexploded, angle, extent / 2.0D, 0);
            Point2D point1 = arc1.getEndPoint();
            //java.awt.geom.Arc2D.Double arc2 = new java.awt.geom.Arc2D.Double(exploded, angle, extent / 2.0D, 0); //original code
            Rectangle2D mix = new Rectangle2D.Double(exploded.getX(), exploded.getY(), unexploded.getWidth(), unexploded.getHeight());
            java.awt.geom.Arc2D.Double arc2 = new java.awt.geom.Arc2D.Double(mix, angle, extent / 2.0D, 0);

            Point2D point2 = arc2.getEndPoint();
            double deltaX = (point1.getX() - point2.getX()) * explodePercent;
            double deltaY = (point1.getY() - point2.getY()) * explodePercent;
            //return new java.awt.geom.Rectangle2D.Double(unexploded.getX() - deltaX, unexploded.getY() - deltaY, unexploded.getWidth(), unexploded.getHeight()); original code
            return new java.awt.geom.Rectangle2D.Double(unexploded.getX() - deltaX, unexploded.getY() - deltaY, exploded.getWidth(), exploded.getHeight());
        } else {
            this.setSectionDepth(0.3);//default depth
            return super.getArcBounds(unexploded, exploded, angle, extent, explodePercent);
        }
    }


    private void logDataArea(Rectangle2D dataArea, String msg) {
        System.out.println(msg + " h="+dataArea.getHeight() + ", w=" + dataArea.getWidth() + ", x=" + dataArea.getX() + ",y="+dataArea.getY());
    }


}
-
我正在用JavaFX制作一个2D游戏,当检测到冲突时,我得到的结果相当不准确,因为玩家精灵被设置为矩形的填充,因此没有预期的边框。有没有办法让我自己的形状尽可能准确? 我的另一个想法是检查碰撞的像素是否透明,然后如果它是,则不会结束游戏。有谁知道一种方法可以获得碰撞像素的坐标,以便从那里我可以使用PixelReader进行检查? 如果有人知道更好的方法,请告诉我! 谢谢,伊森
-
我已经在网上搜索了足够多的东西,但没有运气。 我已经创建了一个堆叠的3D条形图,其中我无法更改默认颜色。我试了所有提供的建议。 EvenI使用了,但它不起作用。与图表、情节和渲染器中的创作顺序有关吗? 当我打印行和列时,我得到以下信息:
-
我正在使用jFreechart创建这样的折线图(取自演示): 是否可以将范围和域转换为Unicode编码系统? 非常感谢。
-
问题内容: 因此,我使用Java Swing为我的应用程序构建UI,并使用自定义图像替换难看的Java图像,这些自定义图像具有样式,并且很容易集成到Java Swing中。 现在我的问题是我需要使用一个在一个应用程序,我真的不想使用默认的Java滚动条,甚至本机OS滚动条。 我只希望能够将自定义图像作为滚动条的背景,并将图像作为滚动条的Thumb。 如何使用图像制作自定义JScrollBar? 问
-
问题内容: 我正在尝试创建一个条形图,该条形图从for循环内生成一个数据集。 数据是。现在,当数据经过所有这些操作并生成图形时,仅显示值5的条。值10的分隔条在哪里?有人知道我在做什么错吗?任何帮助表示赞赏。谢谢 编辑:这是条形图的代码: 问题答案: 我猜你在犯一个小错误,那就是。因此,每次将每个项目添加到一个单独的对象中,并使用具有最后一个值的最终实例来创建图表时,这就是在图表中仅获得最后一个值