检测视频流中的某个对象
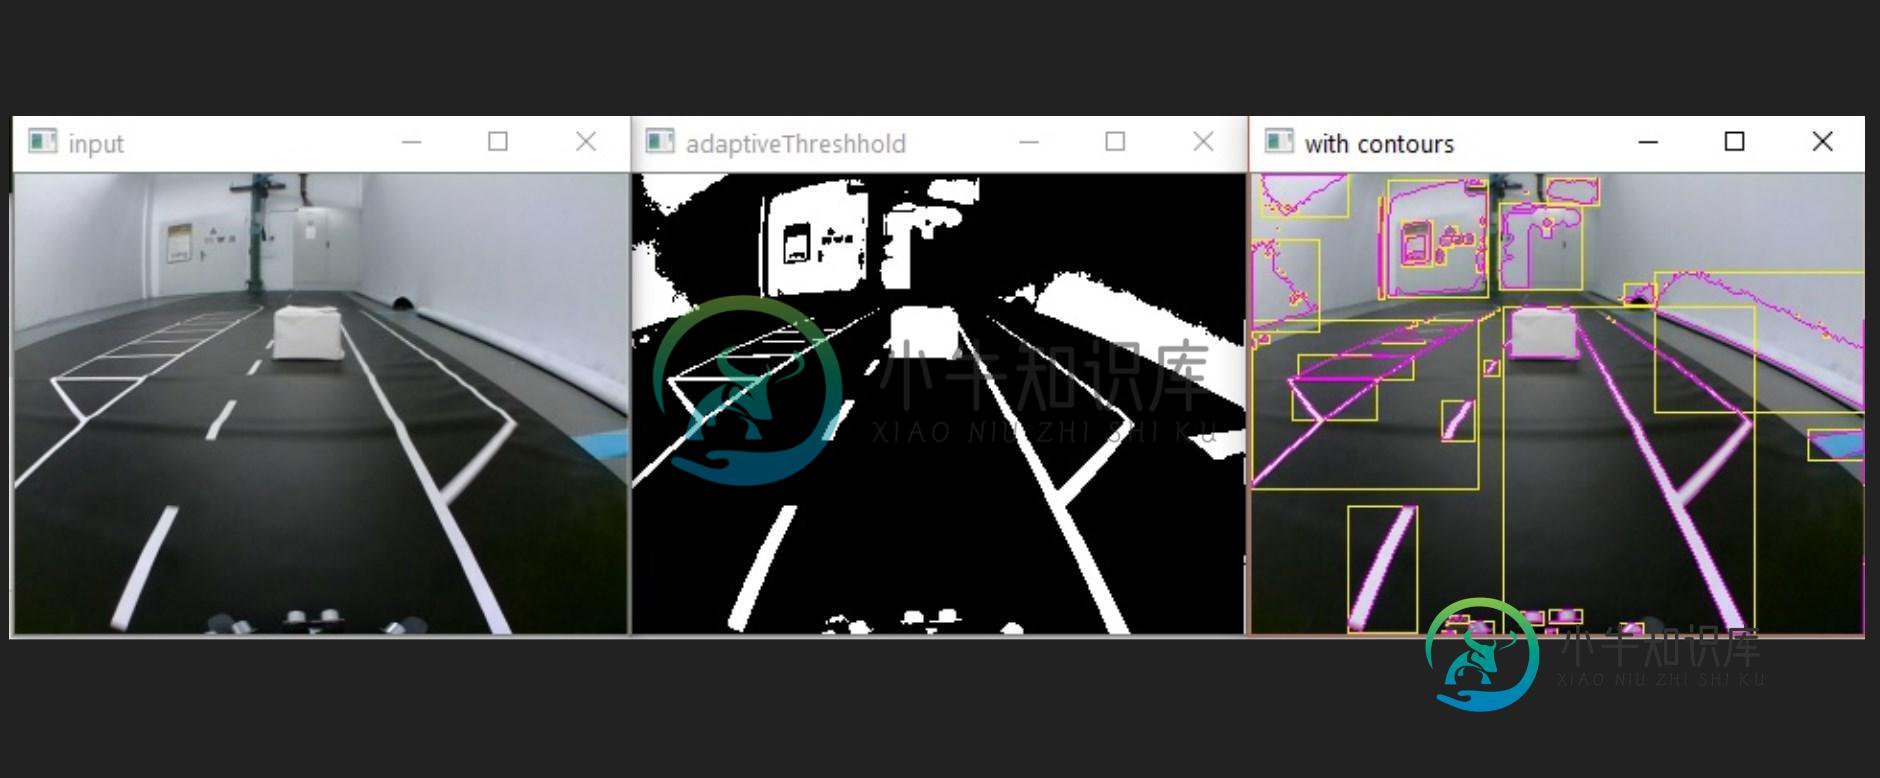
我试图在黑白道路上探测一个白色物体,让一辆自动遥控汽车在它周围行驶。除了路上的白色盒子,我什么都能探测到。
我所尝试的可以在我的代码示例中看到
#input= one video stream frame 320x240
frame = copy.deepcopy(input)
grayFrame = cv2.cvtColor(frame,cv2.COLOR_BGR2GRAY)
threshGray = cv2.adaptiveThreshold(
            grayFrame,
            255,
            cv2.ADAPTIVE_THRESH_MEAN_C,
            cv2.THRESH_BINARY,
            blockSize=123,
            C=-19,
        )
contours,_ = cv2.findContours(threshGray, cv2.RETR_TREE, cv2.CHAIN_APPROX_SIMPLE)
for cnt in contours:

   #some filtering needs to be done
   #
   #after filtering append contour

   filteredContours.append(cnt)
   cv2.rectangle(frame, (x, y), (x + w, y + h), (3, 244, 244), 1)

cv2.drawContours(frame, filteredContours, -1, (255, 0, 255),1 )
cv2.imshow("with contours", frame)
cv2.imshow("adaptiveThreshhold", threshGray)
cv2.imshow("input", input)
我在寻找一种在障碍物周围画边界框的方法。问题是我不知道如何从剩下的盒子里取出这个盒子。这可能是因为长方体的轮廓和右边的线是相连的,这就是为什么边界框那么大。如果有人知道怎么做就好了。
点击这里查看结果

第一:输入图像
第二:适应阈值之后
第三:轮廓(粉色)和边框(黄色)
共有2个答案
我认为你正在寻找的是三角形掩蔽,正如在输入图像中看到的那样,你也有车道标记。尝试使用车道检测器,所有车道外的区域都可以被掩蔽,只有车道内的空间可以被处理。
下面我尝试使用HoughLinesP和添加的轮廓来使用车道检测器。尝试使用这个,我没有测试这个代码,但我没有看到任何问题。
#! /usr/bin/env python 3
"""
Lane detector using the Hog transform method
"""
import cv2 as cv
import numpy as np
# import matplotlib.pyplot as plt
import random as rng

rng.seed(369)

def do_canny(frame):
    # Converts frame to grayscale because we only need the luminance channel for detecting edges - less computationally expensive
    gray = cv.cvtColor(frame, cv.COLOR_RGB2GRAY)
    # Applies a 5x5 gaussian blur with deviation of 0 to frame - not mandatory since Canny will do this for us
    blur = cv.GaussianBlur(gray, (5, 5), 0)
    # Applies Canny edge detector with minVal of 50 and maxVal of 150
    canny = cv.Canny(blur, 50, 150)
    return canny

def do_segment(frame):
    # Since an image is a multi-directional array containing the relative intensities of each pixel in the image, we can use frame.shape to return a tuple: [number of rows, number of columns, number of channels] of the dimensions of the frame
    # frame.shape[0] give us the number of rows of pixels the frame has. Since height begins from 0 at the top, the y-coordinate of the bottom of the frame is its height
    height = frame.shape[0]
    # Creates a triangular polygon for the mask defined by three (x, y) coordinates
    polygons = np.array([
                            [(0, height), (800, height), (380, 290)]
                        ])
    # Creates an image filled with zero intensities with the same dimensions as the frame
    mask = np.zeros_like(frame)
    # Allows the mask to be filled with values of 1 and the other areas to be filled with values of 0
    cv.fillPoly(mask, polygons, 255)
    # A bitwise and operation between the mask and frame keeps only the triangular area of the frame
    segment = cv.bitwise_and(frame, mask)
    return segment

def calculate_lines(frame, lines):
    # Empty arrays to store the coordinates of the left and right lines
    left = []
    right = []
    # Loops through every detected line
    for line in lines:
        # Reshapes line from 2D array to 1D array
        x1, y1, x2, y2 = line.reshape(4)
        # Fits a linear polynomial to the x and y coordinates and returns a vector of coefficients which describe the slope and y-intercept
        parameters = np.polyfit((x1, x2), (y1, y2), 1)
        slope = parameters[0]
        y_intercept = parameters[1]
        # If slope is negative, the line is to the left of the lane, and otherwise, the line is to the right of the lane
        if slope < 0:
            left.append((slope, y_intercept))
        else:
            right.append((slope, y_intercept))
    # Averages out all the values for left and right into a single slope and y-intercept value for each line
    left_avg = np.average(left, axis = 0)
    right_avg = np.average(right, axis = 0)
    # Calculates the x1, y1, x2, y2 coordinates for the left and right lines
    left_line = calculate_coordinates(frame, left_avg)
    right_line = calculate_coordinates(frame, right_avg)
    return np.array([left_line, right_line])

def calculate_coordinates(frame, parameters):
    slope, intercept = parameters
    # Sets initial y-coordinate as height from top down (bottom of the frame)
    y1 = frame.shape[0]
    # Sets final y-coordinate as 150 above the bottom of the frame
    y2 = int(y1 - 150)
    # Sets initial x-coordinate as (y1 - b) / m since y1 = mx1 + b
    x1 = int((y1 - intercept) / slope)
    # Sets final x-coordinate as (y2 - b) / m since y2 = mx2 + b
    x2 = int((y2 - intercept) / slope)
    return np.array([x1, y1, x2, y2])

def visualize_lines(frame, lines):
    # Creates an image filled with zero intensities with the same dimensions as the frame
    lines_visualize = np.zeros_like(frame)
    # Checks if any lines are detected
    if lines is not None:
        for x1, y1, x2, y2 in lines:
            # Draws lines between two coordinates with green color and 5 thickness
            cv.line(lines_visualize, (x1, y1), (x2, y2), (0, 255, 0), 5)
    return lines_visualize

# The video feed is read in as a VideoCapture object
cap = cv.VideoCapture(1)
while (cap.isOpened()):
    # ret = a boolean return value from getting the frame, frame = the current frame being projected in the video
    ret, frame = cap.read()
    canny = do_canny(frame)
    cv.imshow("canny", canny)
    # plt.imshow(frame)
    # plt.show()
    segment = do_segment(canny)
    hough = cv.HoughLinesP(segment, 2, np.pi / 180, 100, np.array([]), minLineLength = 100, maxLineGap = 50)
    # Averages multiple detected lines from hough into one line for left border of lane and one line for right border of lane
    lines = calculate_lines(frame, hough)
    # Visualizes the lines
    lines_visualize = visualize_lines(frame, lines)
    cv.imshow("hough", lines_visualize)
    # Overlays lines on frame by taking their weighted sums and adding an arbitrary scalar value of 1 as the gamma argument
    output = cv.addWeighted(frame, 0.9, lines_visualize, 1, 1)
    contours, _ = cv.findContours(output, cv.RETR_TREE, cv.CHAIN_APPROX_SIMPLE)

    contours_poly = [None]*len(contours)
    boundRect = [None]*len(contours)
    centers = [None]*len(contours)
    radius = [None]*len(contours)
    for i, c in enumerate(contours):
        contours_poly[i] = cv.approxPolyDP(c, 3, True)
        boundRect[i] = cv.boundingRect(contours_poly[i])
        centers[i], radius[i] = cv.minEnclosingCircle(contours_poly[i])
    ## [allthework]

    ## [zeroMat]
    drawing = np.zeros((output.shape[0], output.shape[1], 3), dtype=np.uint8)
    ## [zeroMat]

    ## [forContour]
    # Draw polygonal contour + bonding rects + circles
    for i in range(len(contours)):
        color = (rng.randint(0,256), rng.randint(0,256), rng.randint(0,256))
        cv.drawContours(drawing, contours_poly, i, color)
        cv.rectangle(drawing, (int(boundRect[i][0]), int(boundRect[i][1])), \
          (int(boundRect[i][0]+boundRect[i][2]), int(boundRect[i][1]+boundRect[i][3])), color, 2)

    # Opens a new window and displays the output frame
    cv.imshow('Contours', drawing)
    # Frames are read by intervals of 10 milliseconds. The programs breaks out of the while loop when the user presses the 'q' key
    if cv.waitKey(10) & 0xFF == ord('q'):
        break
# The following frees up resources and closes all windows
cap.release()
cv.destroyAllWindows()
尝试在精明阈值中的不同值。
在这个时间点上,你得到了几个白色颜值的候选人。
您需要将代码添加到#需要进行一些过滤,以去除候选列表中您想要查找的非边界框。
我建议你把你的候选人名单和尽可能大的方格比较一下。
因为所有没有长方体的轮廓(你想在路上找到)都不满足我上面提到的关于方形长方体的条件。
-
我试图转码一个单一的视频文件与1个视频流和几个音频流到文件具有相同的视频流在不同的比特率/大小与正确的填充在同一时间。 我使用的命令是: 实际上,对同一个文件进行几个比特率的代码转换是可能的吗?
-
我试图从覆盆子派流视频使用aws kinesis视频流。我们在Aws站点上使用了C++sdk(https://github.com/awslabs/amazon-kinesis-video-streams-producer-sdk-cpp) [错误][19-04-2020 19:20:33:859.598 GMT]createKinesisVideoStreamSync():未能创建Kinesis
-
问题内容: 您如何检测HTML5 元素何时播放完毕? 问题答案: 您可以添加带有“ end”作为第一个参数的事件监听器 像这样 :
-
我有一个blob数组(实际上是二进制数据--我可以表达它是最有效的。我现在使用Blobs,但可能或其他更好的方法)。每个Blob包含1秒的音频/视频数据。每秒都会生成一个新的Blob并将其追加到我的数组中。因此代码大致如下所示: 我的目标是将此音频/视频数据流式传输到HTML5元素。我知道Blob URL可以像下面这样生成和播放:
-
3.49 获取视频某自定义ID的流量数据 3.49.1 获取视频某自定义ID某天小时维度流量数据 通过该接⼝可以根据用户自定义的customid获取某视频的某天的小时维度流量数据 地址: https://spark.bokecc.com/api/traffic/video/custom/hourly 需要传递以下参数: 参数 说明 userid 用户ID,必选 videoid 视频ID,必选 c
-
我可以从我的机器发送一个RTSP视频流到亚马逊Kinesis视频流。我想知道是否有可能从一个边缘设备发送多个RTSP视频流(多个生产者)?目前我关注的文档是https://docs.aws.amazon.com/kinesisvideostreams/latest/dg/examples-gstreamer-plugin.html#examples-gstreamer-plugin-docker。

