ggplot2:使用cowplot创建主题标题、副标题
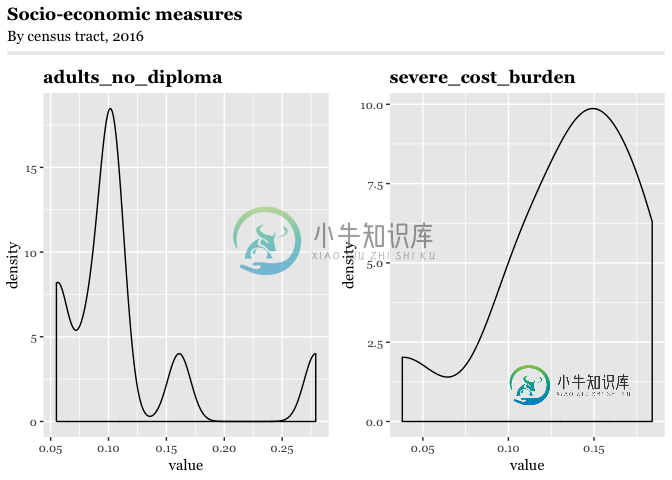
我有一个数据帧的列表,我用它来制作一个ggploe的列表,然后用cowploe组装成一个图形网格。然后我需要附加一个共享的标题,字幕和标题。我想这样做,这些标签将具有相同的主题元素(大小,字体等),就像它们是由labs创建的,而不是
。
在我的实际情况中,我有几个choropleth,每个都有自己的单位和比例,这就是为什么我不能只是刻面,而是需要构建彼此独立的地块。
以下是数据的简化版本,以及我加载的包:
library(tidyverse)
library(cowplot)

dfs <- list(
  adults_no_diploma = structure(list(
    tract = c("09003405100", "09003405200", "09003405300", "09003405401", "09003405402", "09003405500", "09003405600", "09003405700", "09003405800", "09003405900"),
    value = c(0.08, 0.108, 0.095, 0.099, 0.105, 0.103, 0.161, 0.279, 0.056, 0.055)),
    row.names = c(NA, -10L), class = c("tbl_df", "tbl", "data.frame")),
  severe_cost_burden = structure(list(
    tract = c("09003405100", "09003405200", "09003405300", "09003405401", "09003405402", "09003405500", "09003405600", "09003405700", "09003405800", "09003405900"),
    value = c(0.128, 0.147, 0.165, 0.1, 0.151, 0.11, 0.179, 0.184, 0.14, 0.038)),
    row.names = c(NA, -10L), class = c("tbl_df", "tbl", "data.frame"))
)
我正在使用自定义主题(再次简化版本):
theme_georgia <- function(...) {
  theme_gray(base_family = "Georgia", ...) +
    theme(plot.title = element_text(face = "bold"))
}

plots <- dfs %>%
  imap(~{
    ggplot(.x, aes(x = value)) +
      geom_density() +
      ggtitle(.y) +
      theme_georgia()
    })

gridded <- plot_grid(plotlist = plots, nrow = 1)
在cowplotannotations vignette之后,我可以使用ggdraw()draw_标签(“社会经济指标”)制作一个标题,并手动设置字体大小之类的内容,但我更愿意以某种方式将该标签定义为标题;也就是说,主题将应用情节中的所有内容。标题,用于创建字幕和标题。
我目前的解决方法是使用labs为标题和副标题创建一个空的ggplot,对标题执行相同的操作,并使用cowplot::plot\u grid垂直堆叠它们。
title_gg <- ggplot() +
  labs(title = "Socio-economic measures", subtitle = "By census tract, 2016") +
  theme_georgia()
plot_grid(title_gg, gridded, ncol = 1, rel_heights = c(0.15, 1))

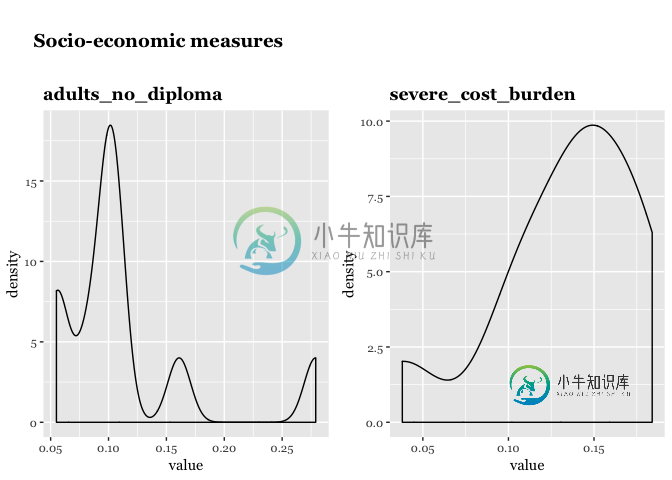
解决方法还可以,但我喜欢draw\u label带来的整洁和对齐。我可以一个接一个地添加这些主题元素来模拟标题:
title_theme <- ggdraw() +
  draw_label("Socio-economic measures",
             fontfamily = theme_georgia()$text$family,
             fontface = theme_georgia()$plot.title$face, x = 0.05, hjust = 0)
plot_grid(title_theme, gridded, ncol = 1, rel_heights = c(0.2, 1))

我的问题是,是否有任何方法可以组合这些方法来提取所有相关的主题元素,并快速将它们提供给draw_label,或者以某种方式告诉draw_label,这是一个标题,应该得到标题主题元素,而另一个是字幕,等等。我想象着这样的魔法:
ggdraw() +
  draw_label("Socio-economic measures", theme_georgia()$plot.title_elements)
或:
ggdraw() +
  draw_label("Socio-economic measures", type = "title") + theme_georgia()
共有2个答案
@克劳斯·威尔克(Claus Wilke)的解决方案完成了任务,但我受到启发,围绕draw_label编写了一个包装函数,以获得模仿主题元素所需的样式。我在这里发布,以防它对其他人有用,尽管这可能是一个奇怪的用例。
此函数采用主题函数,或者,如果省略了theme,则从theme\u get获取当前主题。它还采用主题元素的名称,例如“plot.title”,从中获得带有calc\u元素的样式。所有必需的参数与中的任何其他参数一起传递给cowplot::draw_label
如x或hjust。
library(tidyverse)
library(cowplot)

draw_label_theme <- function(label, theme = NULL, element = "text", ...) {
  if (is.null(theme)) {
    theme <- ggplot2::theme_get()
  }
  if (!element %in% names(theme)) {
    stop("Element must be a valid ggplot theme element name")
  }

  elements <- ggplot2::calc_element(element, theme)

  cowplot::draw_label(label,
                      fontfamily = elements$family,
                      fontface = elements$face,
                      colour = elements$color,
                      size = elements$size,
                      ...
  )
}

title <- ggdraw() +
  draw_label_theme("Socio-economic measures",
                   theme = theme_georgia(), element = "plot.title",
                   x = 0.05, hjust = 0, vjust = 1)
subtitle <- ggdraw() +
  draw_label_theme("By census tract, 2016",
                   theme = theme_georgia(), element = "plot.subtitle",
                   x = 0.05, hjust = 0, vjust = 1)
现在唯一困难的部分是在rel_heights中整齐地排列东西,我可以在这里处理更多。可能有定位信息可以从主题中拉出并用于设置高度。
plot_grid(title, subtitle, gridded, ncol = 1, rel_heights = c(0.1, 0.1, 1))
像这样?
library(ggplot2)
library(cowplot)

theme_georgia <- function(...) {
  theme_gray(base_family = "Georgia", ...) +
    theme(plot.title = element_text(face = "bold"))
}


title_theme <- calc_element("plot.title", theme_georgia())

ggdraw() +
  draw_label(
    "Socio-economic measures",
    fontfamily = title_theme$family,
    fontface = title_theme$face,
    size = title_theme$size
  )
由reprex软件包(v0.2.0)于2018年6月21日创建。
-
副标题是特殊的列表区块,它描绘出一个列表或是网格的不同部分,通常与当前的筛选条件或排序条件相关。 副标题可以内联展示在区块里,也可以关联到内容里,例如,关联在相邻的分组列表里。 在滚动的过程中,副标题一直固定在屏幕的顶部,除非屏幕切换或被其他副标题替换。 为了提高分组内容的视觉效果,可以用系统颜色来显示副标题。 列表副标题 区块高度是 48dp。 副标题字体为 Roboto Medium 14sp
-
Atom的界面使用HTML渲染,并且通过Less来定义样式,它是CSS的超集。不要担心之前从未听说过Less,它类似于CSS,但是带有一些便捷的扩展。 Atom支持两种主题:UI和语法。UI主题为树视图、选择夹、下拉列表和状态栏之类的元素定义样式。语法主题为编辑器中的代码定义样式。 主题可以从设置视图安装和修改,你可以选择Atom > Preferences…菜单,然后在左侧的侧栏中选择“Inst
-
AdminLTE 使用所有 Bootstrap 4 组件。这是一个回顾 Bootstrap 文档的良好开端,通过它了解此文档未涵盖的各种组件。 在浏览示例页面时如果你想要复制组件,请右键单击该组件并选择“检查元素”它比从页面中获取 HTML 更快。 主标题包含导航栏。导航栏结构与 Bootstrap 略有不同,因为它有 Bootstrap 不提供的组件。导航栏可以通过两种方式创建。这是常规导航栏的
-
问题内容: 我在MongoDB中有文章。我希望文章的URL可读。如果我有一篇名为“如何在Heroku中无缝使用Flask和MongoDB”的文章,则我希望URL类似于。 做到这一点的最佳方法是什么?任何朝着正确方向的指针都值得赞赏。我不确定从哪里开始。 问题答案: 您正在寻找一种生成“子弹”并将其用于标识帖子的方法。 如果您只想使用一个标签,则所有帖子标题都必须具有唯一的标签(这大约意味着一个唯一
-
如何设置标题和子标题在折叠工具栏布局在Android像whatsapp配置文件视图。 我已经附上了相同的屏幕截图样本。
-
类似 (https://visactor.io/vchart/demo/line-chart/basic-line)这样的折线图, 我希望给图表上方添加标题描述,该如何配置?
-
Since 8.2 subtitleClick 点击导航栏副标题触发回调 使用方法 document.addEventListener('subtitleClick', function (e) { alert('subtitle clicked') }, false); 代码演示 基本功能演示 <h1>请点击副标题查看效果</h1> <script> document.addEventLi

