How to plot files with numpy?
顾宸
问题内容:
问题答案:
I have a .dat file that contains two columns of numbers so it looks something
like this:
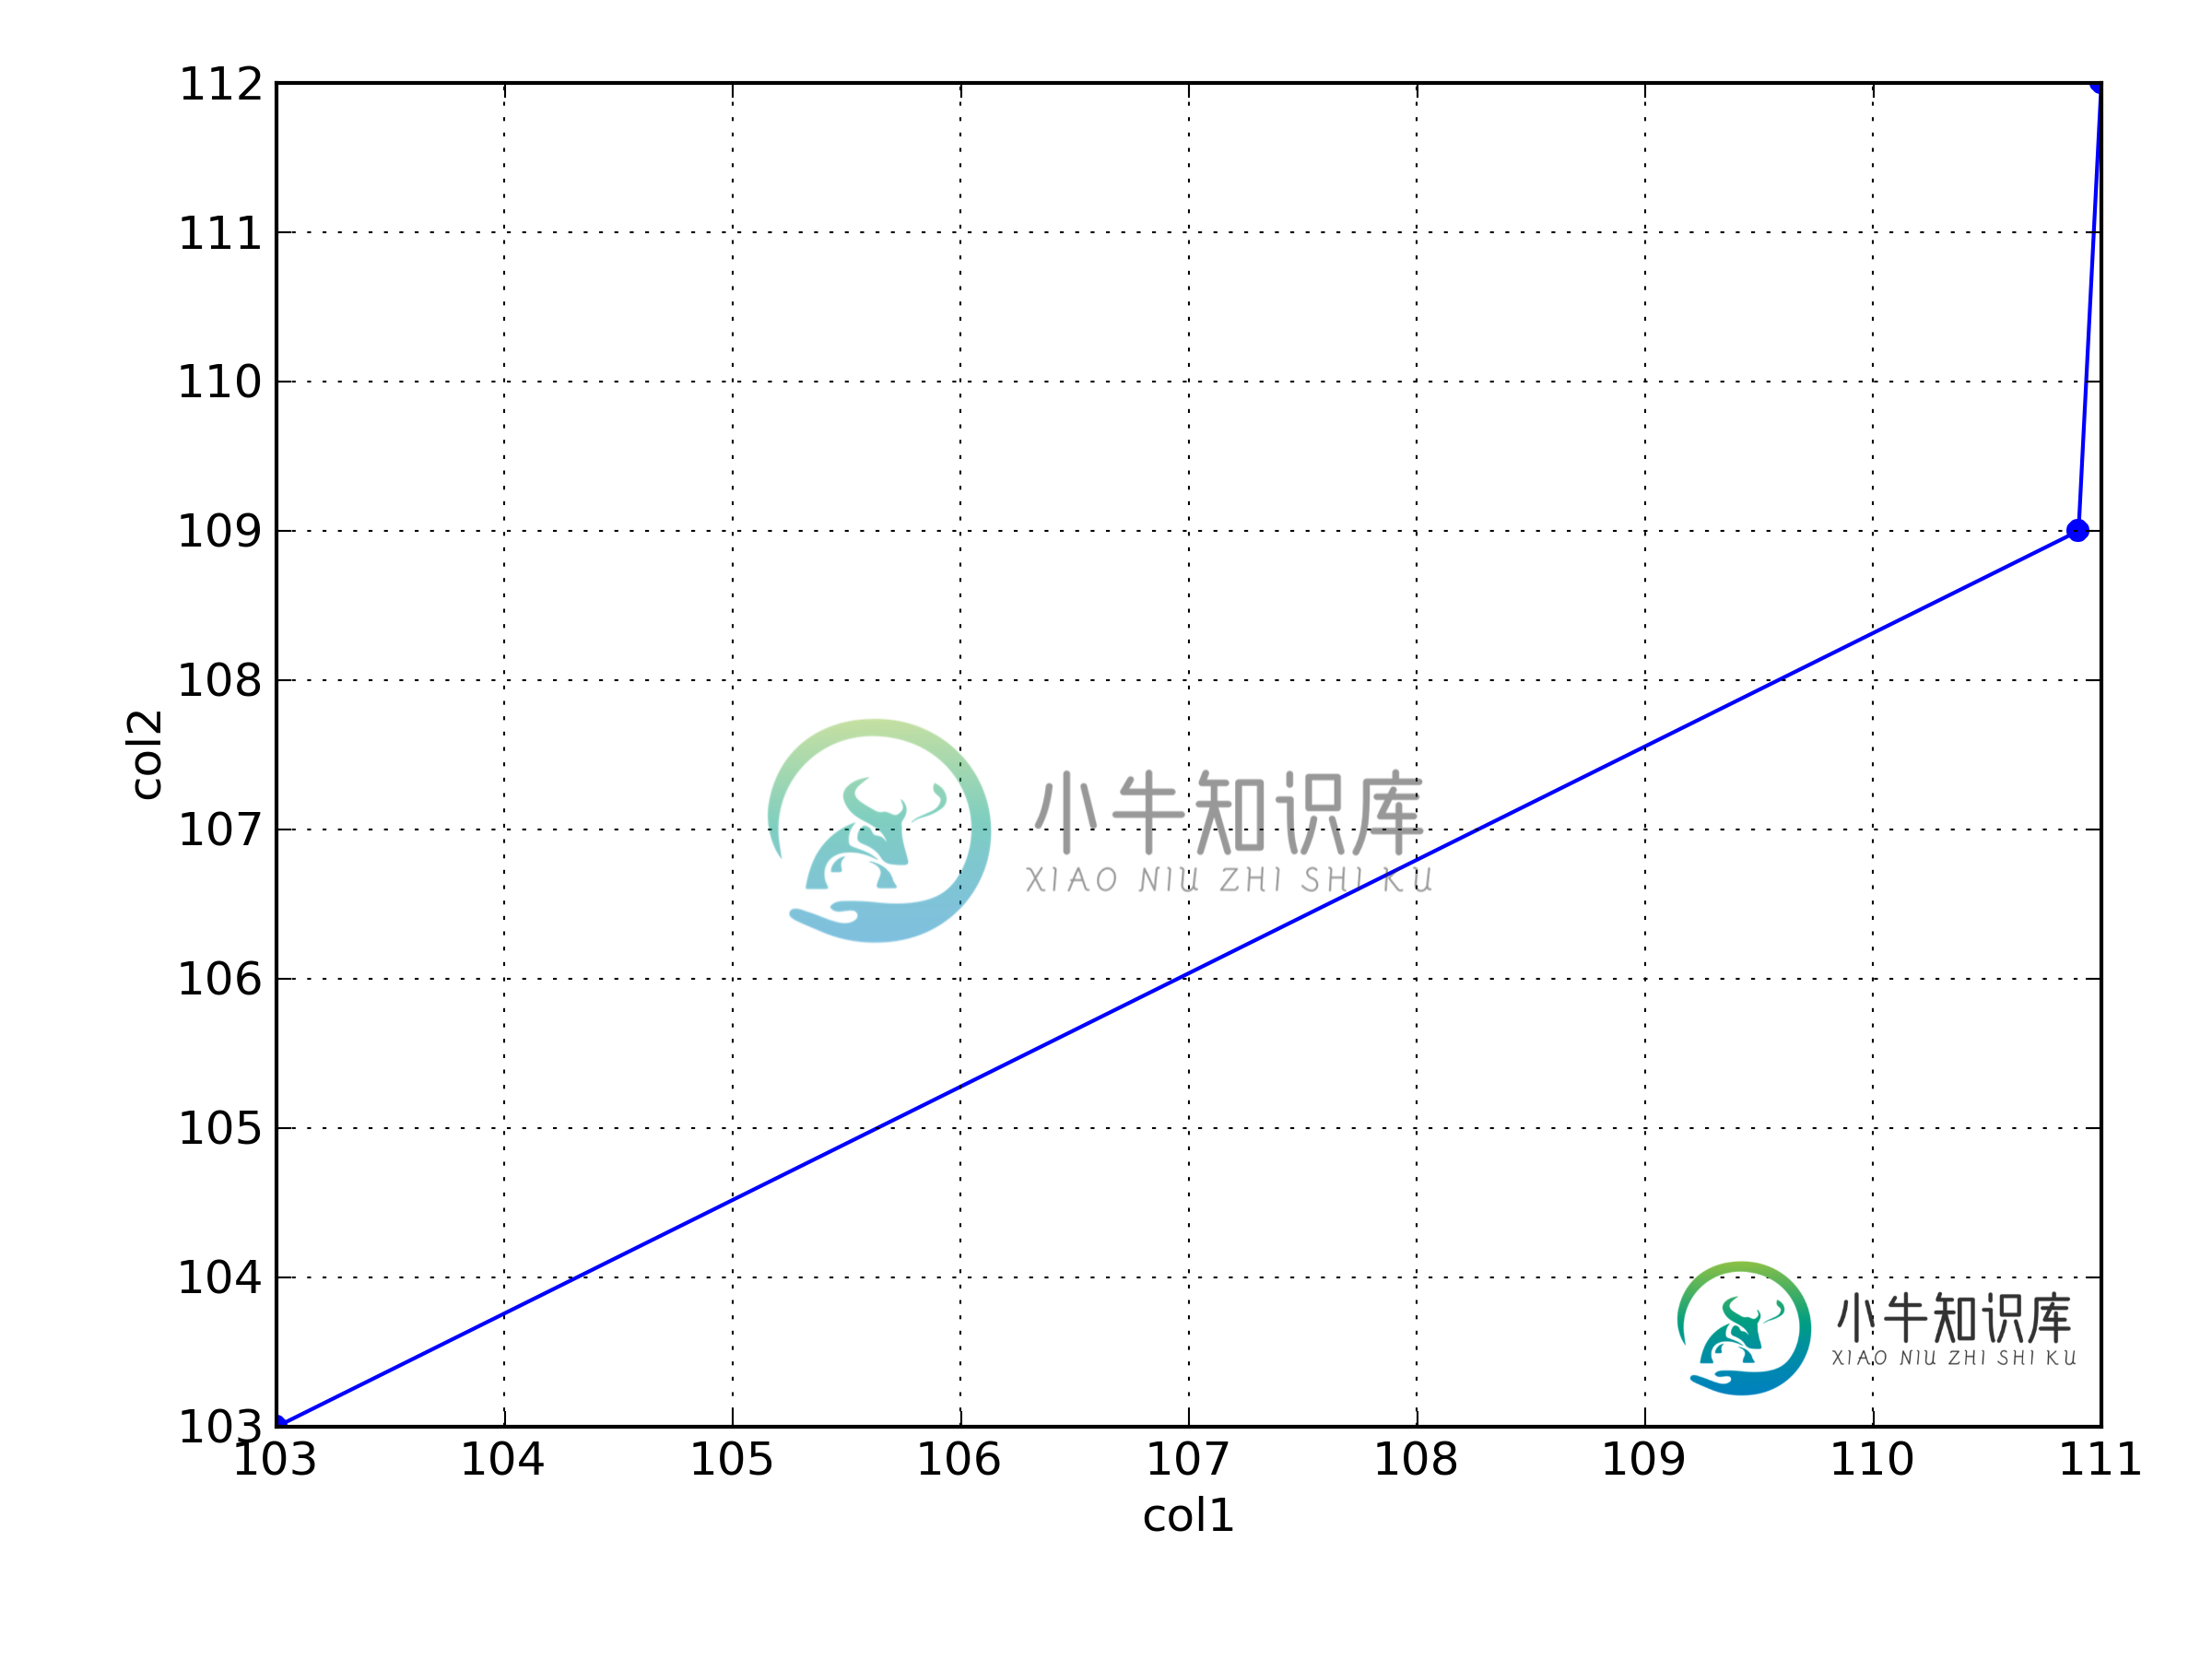
111    112
110.9  109
103    103
and so on.
I want to plot the two columns against one another. I have never dealt with a
.dat file before so I am not sure where to start.
So far I figured out that numpy has something I can use to call.
data = numpy.loadtxt('data.DAT')
but I’m not sure where to go from here. Any ideas?
问题答案:
Numpy doesn’t support plotting by itself. You usually would use
matplotlib for plotting numpy arrays.
If you just want to “look into the file”, I think the easiest way would be to
use
plotfile.
import matplotlib.pyplot as plt

plt.plotfile('data.dat', delimiter=' ', cols=(0, 1),
             names=('col1', 'col2'), marker='o')
plt.show()
You can use this function almost like gnuplot from within ipython:
$ ipython --pylab
...
...
In [1]: plt.plotfile('data.dat', delimiter=' ', cols=(0, 1),
...                  names=('col1', 'col2'), marker='o')
or put it in a shell script and pass the arguments to it to use it directly
from your shell

类似资料:

