
Obtaining span of plotted points from seaborn swarmplot

蔚承天
问题内容:
问题答案:
I have the following data:
import pandas as pd
import numpy as np

# Generate dummy data.
a = np.random.random(75)
b = np.random.random(75) - 0.6
c = np.random.random(75) + 0.75

# Collate into a DataFrame
df = pd.DataFrame({'a': a, 'b': b, 'c': c})
df.columns = [list(['WT', 'MUT', 'WTxMUT']), list(['Parent', 'Parent', 'Offspring'])]
df.columns.names = ['Genotype', 'Status']
df_melt = pd.melt(df)
and I plot it in seaborn using this code:
import seaborn as sb
sb.swarmplot(data = df_melt, x = "Status", y = "value", hue = "Genotype")
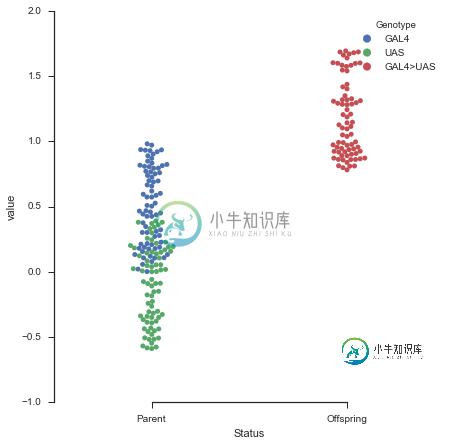
How do I get the x-span of each group? What is the range of the horizontal
span of the swarmplot for the Parent group, for instance?
问题答案:
You can get the information from the collections which are created by
swarmplot.
swarmplot actually returns the matplotlib Axes instance, and from there we
can find the PathCollections that it creates. To get the positions, we can
use .get_offsets().
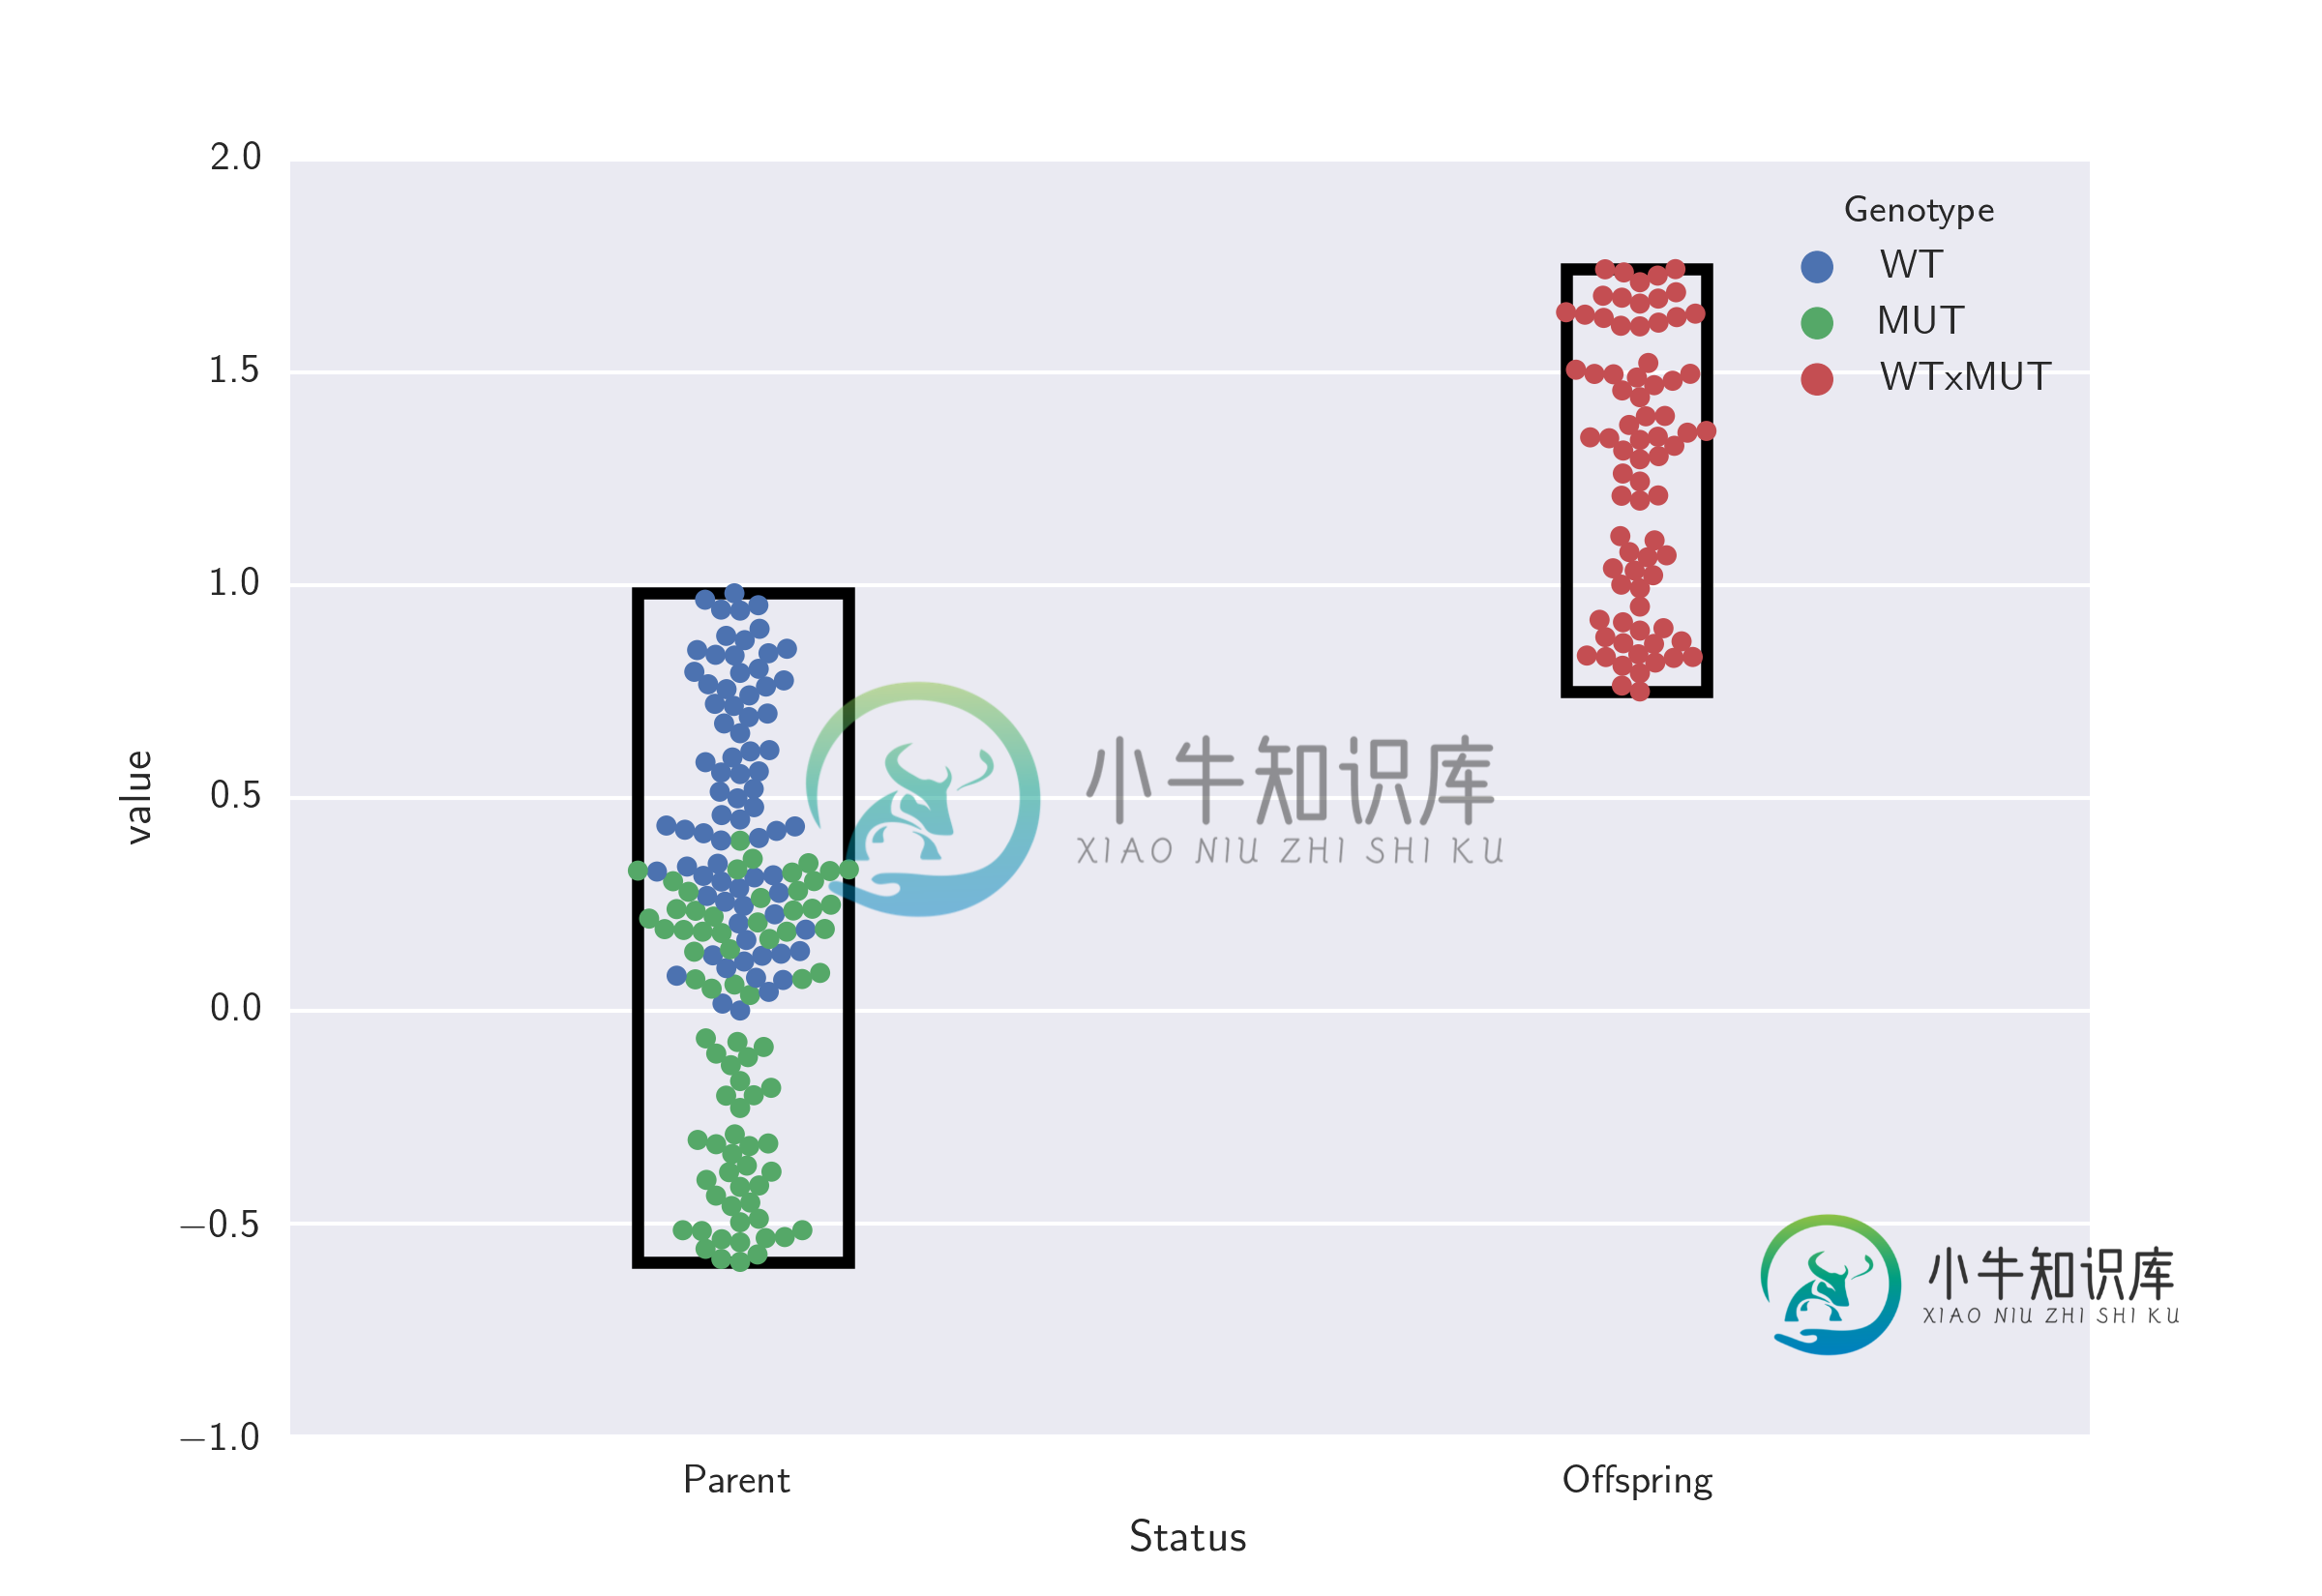
Here is your example, modified to find and print the swarm limits, and then
use them to plot a box around the swarms.
import pandas as pd
import numpy as np
import matplotlib.pyplot as plt
import seaborn as sb
from matplotlib.patches import Rectangle

# Generate dummy data.
a = np.random.random(75)
b = np.random.random(75) - 0.6
c = np.random.random(75) + 0.75

# Collate into a DataFrame
df = pd.DataFrame({'a': a, 'b': b, 'c': c})
df.columns = [list(['WT', 'MUT', 'WTxMUT']), list(['Parent', 'Parent', 'Offspring'])]
df.columns.names = ['Genotype', 'Status']
df_melt = pd.melt(df)

ax = sb.swarmplot(data = df_melt, x = "Status", y = "value", hue = "Genotype")

def getdatalim(coll):
    x,y = np.array(coll.get_offsets()).T
    try:
        print 'xmin={}, xmax={}, ymin={}, ymax={}'.format(
                x.min(), x.max(), y.min(), y.max())
        rect = Rectangle((x.min(),y.min()),x.ptp(),y.ptp(),edgecolor='k',facecolor='None',lw=3)
        ax.add_patch(rect)
    except ValueError:
        pass

getdatalim(ax.collections[0]) # "Parent"
getdatalim(ax.collections[1]) # "Offspring"

plt.show()
which prints:
xmin=-0.107313729132, xmax=0.10661092707, ymin=-0.598534246847, ymax=0.980441247759
xmin=0.942829146473, xmax=1.06105941656, ymin=0.761277608688, ymax=1.74729717464
And here’s the figure:
类似资料: