IntelliJ IDEA 13 debugger don't stop on breakpoint in java for maven project
I have a breakpoint on a line where is the System.out.println("test")
command. I believe that the command is reached by execution because I see the
printed string “test”. But the breakpoint is ignored.
Breakpoint is a red circle all the time, without a tick or cross. I think this
is an issue when IDEA thinks the class is not loaded, while it is, because the
command is executed.
I can reproduce it in various circumstances:
-
When I press debug (with maven configuration
install exec:exec -DforkMode=never) -
Remote debugging - I run maven goal in debug mode in the console:
mvnDebug install exec:exec -DforkMode=never
or
mvnDebug install exec:exec
remote debug configuration in IDEA:
* Arguments for running remote JVM:
-agentlib:jdwp=transport=dt_socket,server=y,suspend=n,address=8000
* For JDK 1.4.X:
-Xdebug -Xrunjdwp:transport=dt_socket,server=y,suspend=n,address=8000
* Transport: Socket
* Debugger mode: Attach
* Host: localhost
* Port: 8000
In both cases the debugger only prints “Connected to the target VM, address:
‘localhost:8000’, transport: ‘socket’“
I have also tried File > Invalidate Caches / Restart and clean build, but
the breakpoint is still ignored.
Configuration:
Ubuntu 13.10
IntelliJ IDEA Ultimate build 133.944
Apache Maven 3.0.4
Java version: 1.7.0_51, vendor: Oracle Corporation
OS name: “linux”, version: “3.11.0-17-generic”, arch: “amd64”, family: “unix”
EDIT: relevant part of pom.xml:
<plugin>
  <groupId>org.codehaus.mojo</groupId>
  <artifactId>exec-maven-plugin</artifactId>
  <version>1.2.1</version>
  <configuration>
    <executable>java</executable>
      <arguments>
        <argument>-D--secret--.server.configuration=/usr/local/etc</argument>
        <argument>-classpath</argument><classpath/>
        <argument>com.--secret--.Server</argument>
      </arguments>
  </configuration>
</plugin>
问题答案:
My solution:
Considering that you have a program that depends on system properties:
package com.mycompany.app;


public class App {

    private static final String GREETING = System.getProperty("greeting", "Hi");

    public static void main(String[] args) {
        int x = 10;
        System.out.println(GREETING);
    }
}
And you are running it with exec:exec:
mvn exec:exec -Dexec.executable=java "-Dexec.args=-classpath %classpath -Dgreeting=\"Hello\" com.mycompany.app.App"
With some “inception magic” we can debug the process started by
Mavenexec:exec.
Change your exec:exec goal to enable remote debugging. I’m using suspend=y
and server=n, but feel free to configure the JDWP
Agent
as you please:
-agentlib:jdwp=transport=dt_socket,server=n,address=127.0.0.1:8000,suspend=y
This will not be passed directly to the maven JVM, instead it will be
passed to exec.args which will be used by exec:exec:
mvn exec:exec -Dexec.executable=java "-Dexec.args=-classpath %classpath -agentlib:jdwp=transport=dt_socket,server=n,address=127.0.0.1:8000,suspend=y -Dgreeting=\"Hello\" com.mycompany.app.App"
IntelliJ IDEA
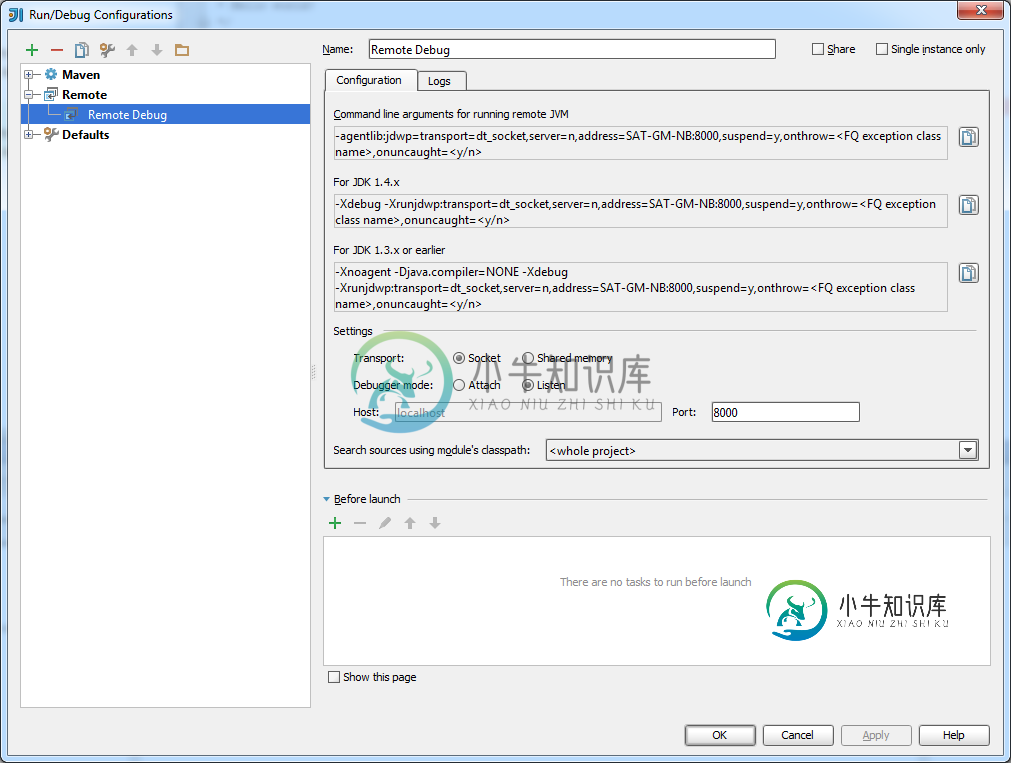
Create a Remote configuration (again I’m using a Listen strategy. You
should adjust it according to your process settings):

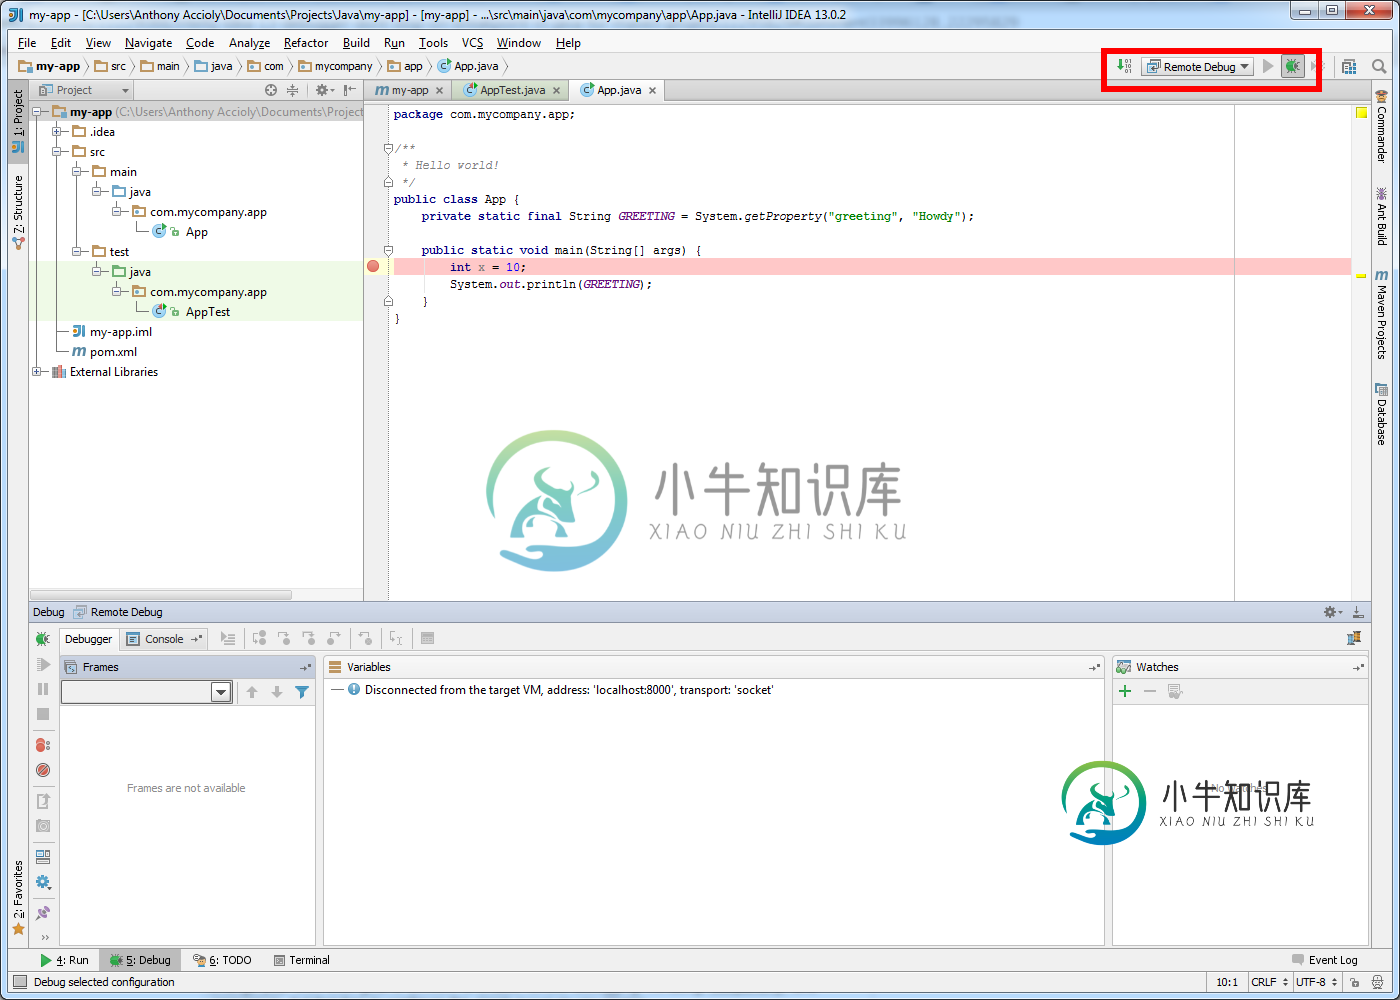
Now toggle your breakpoints and Debug your remote configuration. Using the
settings above it will wait until your process starts:

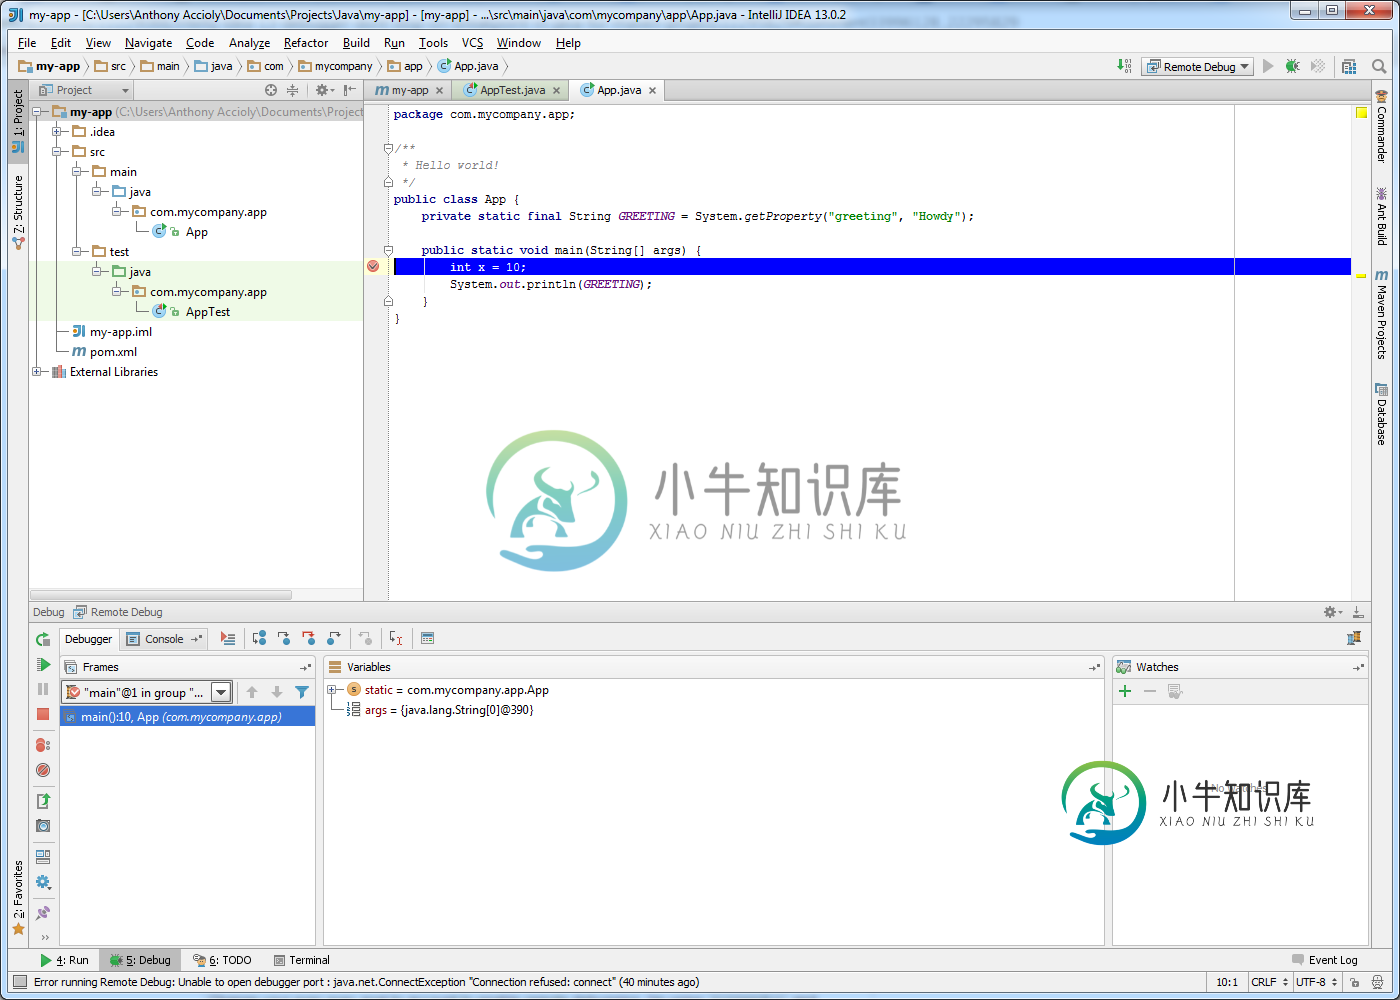
Finally run the exec:exec line above and debug your application at will:

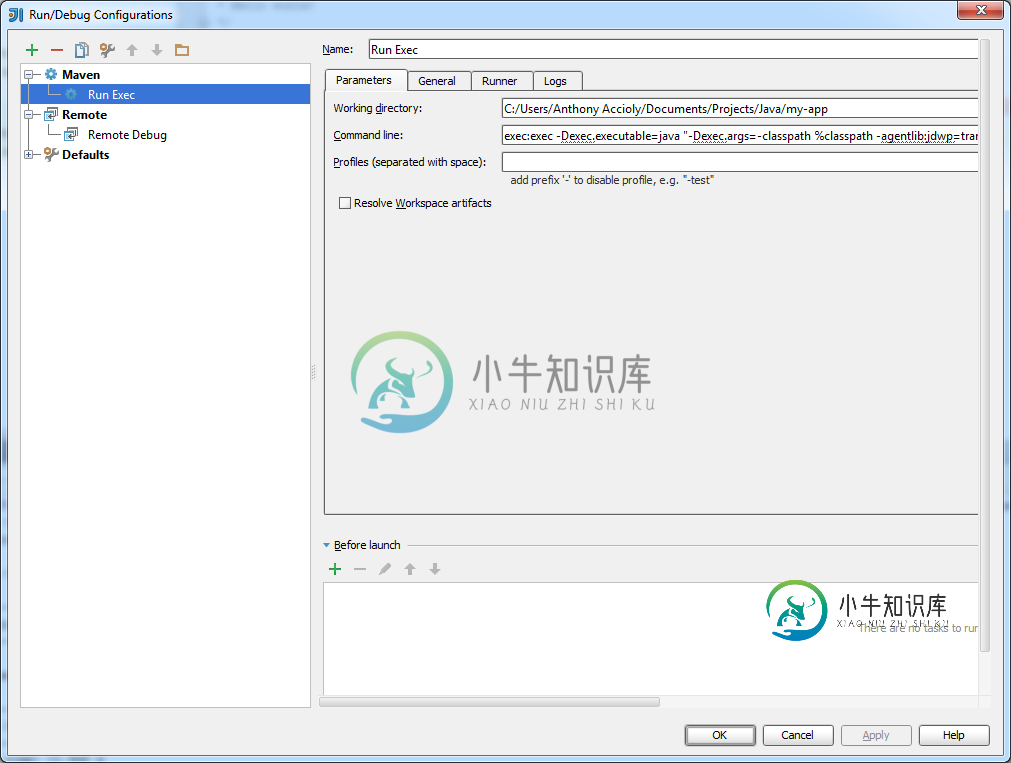
So basically you need two “Run/Debug” configurations for this to work:
- A Maven configuration for
exec:execwith the system properties and JDWP agent configuration:

- The remote configuration acting as a client.

