bitcoin-chart-cli
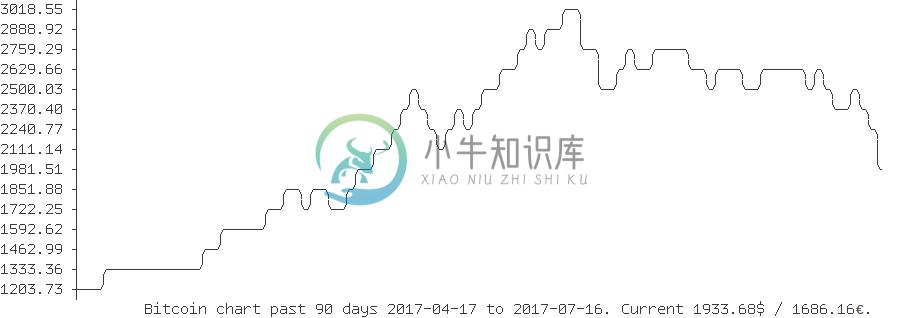
Bitcoin chart for the terminal as command line util.
For a list of supported cryptocurrencies see coins.
You might also be interested in a similar project of
mine wallstreet, which provides information about
stocks instead of cryptocurrencies.
Requirements
- node 8.0 or higher
- npm or yarn
Usage
# install
npm install bitcoin-chart-cli -g

# (alternative) install with yarn
yarn global add bitcoin-chart-cli

# (alternative) run without install
npx bitcoin-chart-cli

# run default
bitcoin-chart-cli

# run with options
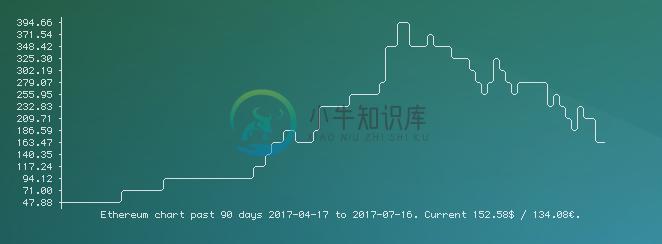
bitcoin-chart-cli --coin ETH -d 360 -w 80 -h 20

# run with your own api key for higher requests limits
export CRYPTOCOMPARE_API_KEY=your_api_key
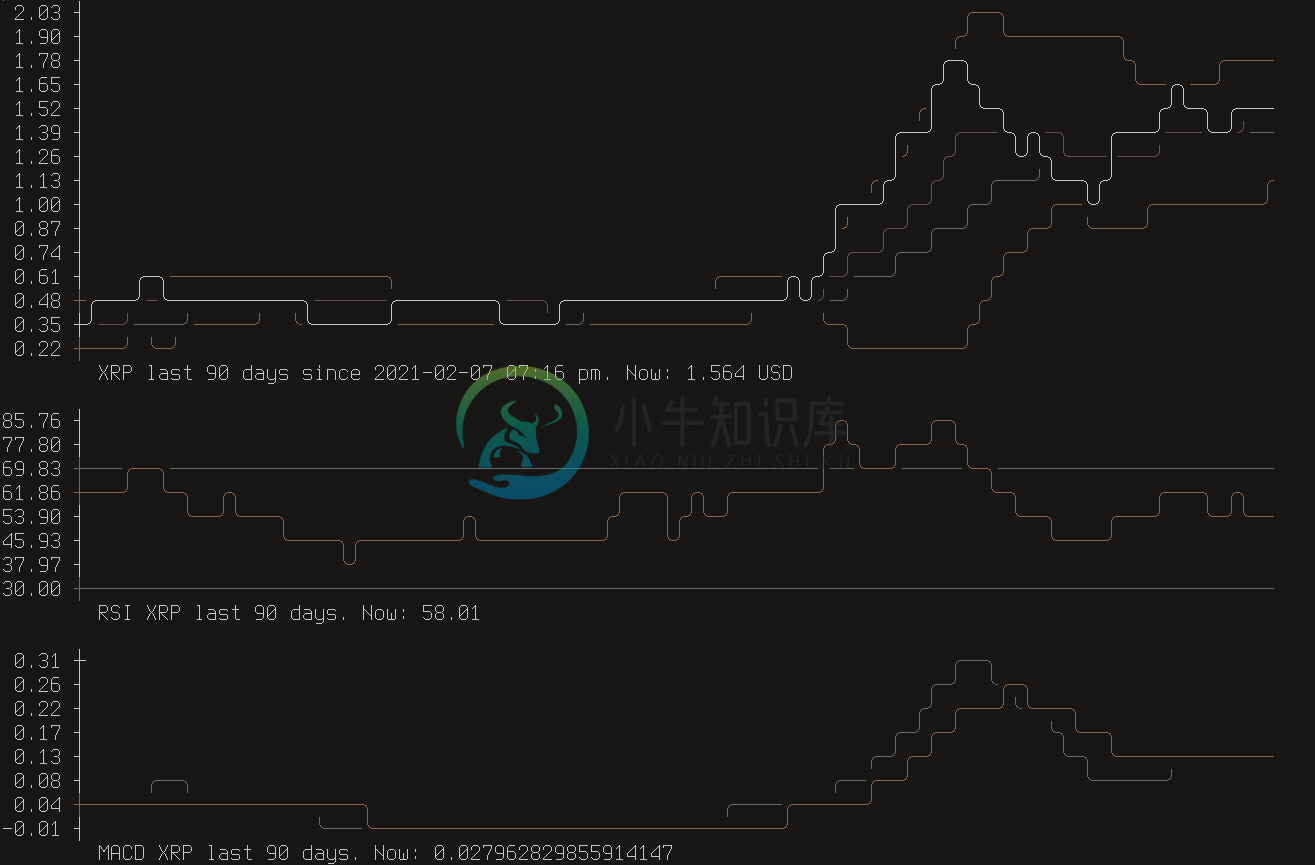
bitcoin-chart-cli --coin XRP -ti RSI SMA BB EMA MACD
Options
bitcoin-chart-cli --help


  Usage: index [options]


  Options:

  -V, --version                         output the version number
  -d, --days <n>                        number of days the chart will go back
  --hours <n>                           number of hours the chart will go back
  --mins <n>                            number of minutes the chart will go back
  -w, --width <n>                       max terminal chart width
  -h, --height <n>                      max terminal chart height
  --max <n>                             max y-axis value
  --min <n>                             min y-axis value
  --min-range <n>                       min range between min and max y-axis value
  -c, --coin <string>                   specify the coin e.g. ETH (default: "BTC")
  --currency <string>                   specify the trading pair currency (default: "USD")
  -l, --list                            list all available coins
  -t, --toplist <n>                     list of top n coins
  --disable-legend                      disable legend text
  -ti, --technical-indicator <type...>  add a technical indicator: RSI SMA BB EMA MACD
  -h, --help                            display help for command
Examples
bitcoin-chart-cli
Create terminal splits (tmux) with watch for live charts the unix way
watch -n 60 bitcoin-chart-cli --mins 30 --width 60
In combination with conky
conky.text = [[ ${execi 120 bitcoin-chart-cli --coin ETH -w 140 -h 15} ]];
bitcoin-chart-cli --toplist 15
Rank  Name                        Price     MktCap     Volume   Change/24h
--------------------------------------------------------------------------
1.    Bitcoin                 $57844.00    1081.8B      25.7B        4.05%
2.    Ethereum                 $3521.65     407.7B      15.0B        2.47%
3.    Binance Coin              $630.03      96.7B       2.2B        1.04%
4.    Dogecoin                    $0.65      84.2B      11.5B       14.61%
5.    XRP                         $1.60      72.6B       4.2B        0.90%
6.    Tether                      $1.00      54.8B      80.8B       -0.00%
7.    Cardano                     $1.66      53.0B       3.0B        8.59%
8.    Polkadot                   $40.99      40.6B       1.3B        1.20%
9.    Bitcoin Cash             $1341.36      25.1B       2.9B       -4.85%
10.   Litecoin                  $344.02      23.0B       4.0B        5.05%
11.   Uniswap                    $40.36      21.1B     390.2M        0.70%
12.   Chainlink                  $49.73      20.8B       1.2B        8.07%
13.   VeChain                     $0.23      15.0B       1.5B       14.39%
14.   Stellar                     $0.64      14.7B     932.3M        1.50%
15.   USD Coin                    $1.00      14.4B     736.5M       -0.05%
Charts with technical indicators
bitcoin-chart-cli --coin XRP -ti RSI SMA BB EMA MACD
-
TreeMap是数据树的直观表示,其中每个节点可以有零个或多个子节点,以及一个父节点(根节点除外)。 每个节点都显示为一个矩形,可以根据我们指定的值进行调整大小和着色。 尺寸和颜色相对于图中的所有其他节点进行估值。 以下是树形图图表的示例。 我们已经在Google Charts Configuration Syntax一章中看到了用于绘制图表的配置 。 现在,让我们看一个TreeMap图表的示例。
-
3D图表是以三维格式出现的图表。 您可以使用这些图表来提供更好的显示和清晰的信息。 3D饼图与饼图相同,具有漂亮的3D效果。 通过添加一些额外的代码可以实现3D效果,这将代表在饼图中创建3D效果。 3D饼图 请考虑以下示例,借助3D饼图来说明移动销售。 以下是不同移动品牌及其销售(每日单位)的列表。 S.No 移动品牌 销售额(每天UNITS) 1 IPhone 5S 20 2 Samsung G
-
Bitcoin (比特币)是点对点(peer-to-peer)基于网络的匿名数字货币。点对点(peer-to-peer)的意思是指没有中央权威控制货币 的汇款通道。相反,这些货币转帐的任务是由网络节点进行的集体管理。匿名就意味着交易各方可以隐藏自己的真实身份。优势: 无需信托中间人,能够方便的进行互联网上的汇款。 第三方不能够控制或者阻止您的交易。 Bitcoin 交易几乎免费, 而信用卡的网上在
-
图表用于表示图形格式的数据。 以下是Ext JS提供的不同图表 - Sr.No 图表 1 饼形图 如名称所示,此图表用于以饼图格式表示数据。 2 折线图 此图表用于以折线图格式表示数据。 3 条形图 此图表用于以条形图格式表示数据。 4 面积图 该图表用于以区域图的形式表示数据。
-
Bitcoin-Qt 是使用 Qt 开发的比特币客户端,目前该项目已经成为比特币官方的客户端,合并到比特币项目中,不再单独立项。
-
Bitcoin ETL Join Telegram Group Install Bitcoin ETL: pip install bitcoin-etl Export blocks and transactions (Schema, Reference): > bitcoinetl export_blocks_and_transactions --start-block 0 --end-block


