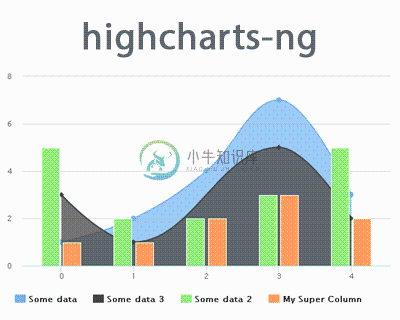
Highcharts-ng 是一个 AngularJS 的指令扩展,实现了在 AngularJS 应用中集成 Highcharts 图表库的功能。

演示地址:http://jsfiddle.net/pablojim/46rhz/
使用方法:
var myapp = angular.module('myapp', ["highcharts-ng"]);
HTML:
<highchart id="chart1" config="chartConfig"></highchart>
chartConfig:
//This is not a highcharts object. It just looks a little like one!
var chartConfig = {

  options: {
      //This is the Main Highcharts chart config. Any Highchart options are valid here.
      //will be overriden by values specified below.
      chart: {
          type: 'bar'
      },
      tooltip: {
          style: {
              padding: 10,
              fontWeight: 'bold'
          }
      }
  },
  //The below properties are watched separately for changes.

  //Series object (optional) - a list of series using normal highcharts series options.
  series: [{
     data: [10, 15, 12, 8, 7]
  }],
  //Title configuration (optional)
  title: {
     text: 'Hello'
  },
  //Boolean to control showng loading status on chart (optional)
  //Could be a string if you want to show specific loading text.
  loading: false,
  //Configuration for the xAxis (optional). Currently only one x axis can be dynamically controlled.
  //properties currentMin and currentMax provied 2-way binding to the chart's maximimum and minimum
  xAxis: {
  currentMin: 0,
  currentMax: 20,
  title: {text: 'values'}
  },
  //Whether to use HighStocks instead of HighCharts (optional). Defaults to false.
  useHighStocks: false,
  //size (optional) if left out the chart will default to size of the div or something sensible.
  size: {
   width: 400,
   height: 300
  },
  //function (optional)
  func: function (chart) {
   //setup some logic for the chart
  }
};-
highcharts再angularJS中生成单例图表非常容易,但是生成多图表比较困难。为此研究了很久。以下为详细说明。 准备工作:1、在directive中封装一个highcharts的指令。 app.directive('highcharts', function () { return { require: '?ngModel', restrict
-
1.内容都正确但是不显示,使用parseInt()方法转换 转载于:https://www.cnblogs.com/zmc-change/p/5918920.html
-
最近在攻克前人留下的坑,爬了好久终于找到了出坑的办法,就差实际行(敲)动(码)了 先说问题,数可视功能用的时候会卡顿,查多天数据会假死,原因是数据量太大了,一天10w+的数据量,查半个月一个月的就用不了了 打算减少详细数据,分阈值加工统计数据然后保存,再查询显示 官网api链接:https://api.highcharts.com.cn/highcharts 然后,如题 和大多博文差不多,先在ht
-
highcharts-ng 的git地址:https://github.com/pablojim/highcharts-ng 我这里使用的npm: npm install highcharts-ng HTML代码片段: <div ng-app="myApp"> <div ng-controller="MyCtrl"> <highchart config="chartConf
-
第一个要介绍的是我们的麻烦制造器:angular-ui-bootstrap ui-bootstrap可以有很多通用的插件给大家用,比如弹窗啊(modal),翻页控件啊(pagination),为什么说它麻烦呢,因为它家官网被墙了,看不到文档!可我就是要用啊,怎么办?老办法,下载来再说: npm install --save-dev angular-ui-bootstrap 然后到mod
-
第一个要介绍的是我们的麻烦制造器:angular-ui-bootstrap ui-bootstrap可以有很多通用的插件给大家用,比如弹窗啊(modal),翻页控件啊(pagination),为什么说它麻烦呢,因为它家官网被墙了,看不到文档!可我就是要用啊,怎么办?老办法,下载来再说: npm install --save-dev angular-ui-bootstrap 然后到mod
-
地图图表用于绘制热图或树状图。在本节中,我们将讨论不同类型的地图图表。 图表类型 描述 热图图表 热图图表 树状图 树状图
-
3D 图表用于绘制 3 维图表。在本节中,我们将讨论不同类型的 3D 图表。 图表类型 描述 3D柱状图 3D柱状图 3D散点图 3D散点图 3D饼图 3D饼图
-
Highcharts 曲线图 以下实例演示了对数图表。 我们在前面的章节已经了解了 Highcharts 配置语法。接下来让我们来看下如何配置。 配置 配置 yAxis.type 为 'logarithmic'。它定义了 x 轴类型。可选值有 "linear", "logarithmic", "datetime" 或 "category"。默认值为linear。 yAxis var yAxis
-
组合图用于绘制混合图;例如,带饼图的条形图。在本节中,我们将讨论不同类型的组合图表。 图表类型 描述 带有柱状图、折线图、饼图 带有柱状图、折线图、饼图 带有双轴、线、柱状的图表 带有双轴、线、柱状的图表 带有多个轴的图表 带有多个轴的图表 带有回归线的散点图 带有回归线的散点图
-
动态图表用于绘制基于数据的图表,其中数据可以在图表呈现后发生变化。在本节中,我们将讨论不同类型的动态图表。 图表类型 描述 每秒更新一次的折线图 每秒更新一次的折线图 添加点功能的图表 添加点功能的图表
-
Highcharts 曲线图 以下实例演示了时间间隔图表。 我们在前面的章节已经了解了 Highcharts 配置语法。接下来让我们来看下如何配置。 实例 文件名:highcharts_spline_time.htm <html> <head> <meta charset="UTF-8" /> <title>Highcharts 教程</title> <script src="http://ap
-
Chart.js 2.0为每个数据集引入了控制器的概念。像scales一样,可以根据需要编写新的控制器。 Chart.controllers.MyType = Chart.DatasetController.extend({}); // 现在我们可以使用Chart.js API创建图表的一个新实例 new Chart(ctx, { // 这是构造函数注册的字符串,即Chart.contr
-
本章节我们将为大家介绍 Highcharts 的3D图。 序号 图表类型 1 3D 柱形图 2 带空值的3D 柱形图 3 堆叠 3D 柱形图 4 3D 饼图 5 3D 圆环图

