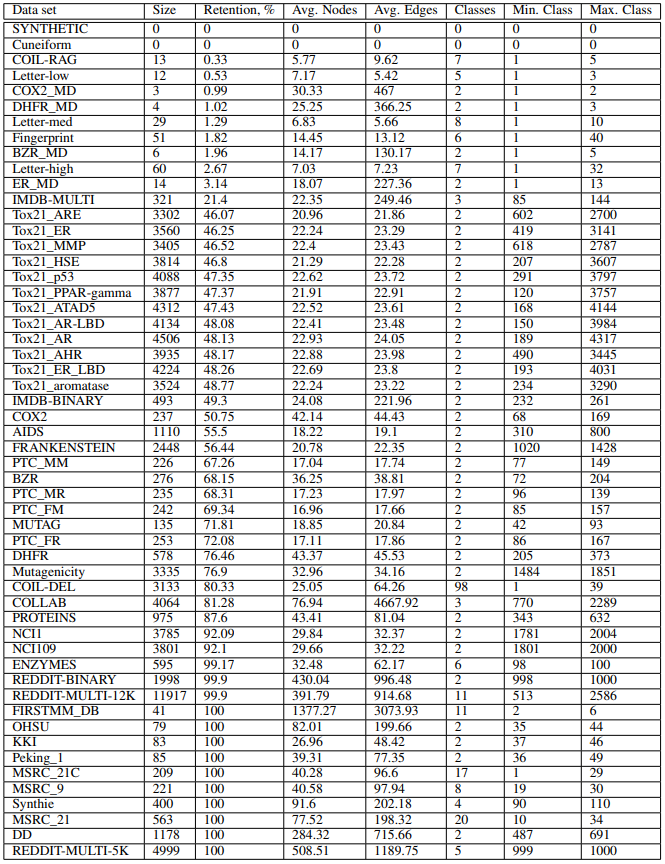
This repo contains manually curated list of graph datasets for evaluation graph classification methods. These data sets are results of removing isomorphic copies of graphs from the original data sets. There are at the moment 54 data sets. The code to generate data sets is available here (https://github.com/nd7141/iso_bias).
To download a particular data set, append a suffix with the name of data set (e.g. MUTAG.zip) to https://raw.githubusercontent.com/nd7141/graph_datasets/master/datasets For example to download MUTAG use the following link: https://raw.githubusercontent.com/nd7141/graph_datasets/master/datasets/MUTAG.zip
If you found our work useful, please consider citing our work.
@misc{ivanov2019understanding,
    title={Understanding Isomorphism Bias in Graph Data Sets},
    author={Sergei Ivanov and Sergei Sviridov and Evgeny Burnaev},
    year={2019},
    eprint={1910.12091},
    archivePrefix={arXiv},
    primaryClass={cs.LG}
}
All datasets are zipped. There is a class GraphDataset that extracts, transforms, and save graphs to necessary formats.
dataset = GraphDataset()

# extract dataset
dataset_path = 'datasets/'
d = 'MUTAG'
output = 'compact/'
dataset.extract_folder(dataset_path + d + '.zip', output)
After the dataset was extracted locally, we can read graphs as a list of GraphStruct object, where
each graph is a collection of nodes, edges, labels/attributes in simple python data structures (list of dict).
GraphStruct also allows creating networkx graphs.
# read graphs
graphs = dataset.read_graphs(output + d + '/')
We can additionally save graphs in graphml format, which will preserve node/edge labels/attributes.
# save graphml
output = 'graphml/'
dataset.save_graphs_graphml(graphs, output + d + '/')
We can also save graphs in edgelist format, which purely keeps topology of a graph.
# save edgelist
output = 'edgelist/'
dataset.save_graphs_edgelist(graphs, output + d + '/')
You can find the same data sets in the PyTorch-Geometric library. To get clean version of the data sets, use parameter cleaned=True in TUDataset class. For example, to train a model on MUTAG data set:
root = './'
dataset = TUDataset(root, 'MUTAG', cleaned=True)
print(dataset)
>>> MUTAG(135)
Compact format of data sets is described in https://ls11-www.cs.tu-dortmund.de/staff/morris/graphkerneldatasets and is efficient for storing large number of graphs. Each data set contains necessarily three files with _A.txt, _graph_indicator.txt, and _graph_labels.txt.
_A.txt is edge list of all graphs in a data set. All nodes consecutive, and no node_ids are the same for two graphs.
_graph_indicator.txt contains mapping between node_id and graph_id, so that lines correspond to nodes and content of lines correspond to graph. For example, if line 35 has 2, it means that node_id = 35 belongs to graph 2.
Finally, _graph_labels.txt contains mapping between graph_id and its target label. graph_id corresponds to a line in a final, and target label corresponds to the content of a line. For example if line 45 contains 2, it means that graph 45 has label 2.
Additionally, folder may include node/edge_labels/attributes.txt files that provide additional information about the graphs.
Graphml format contains each graph in its separate file in graphml format, that includes all meta-information about the graphs.
Edgelist format contains each graph in its seperate file that provides edge list, without any label/attribute information.
In graphml and edgelist formats, the target labels are not generated again and one can use _graph_labels.txt to see the mapping.
